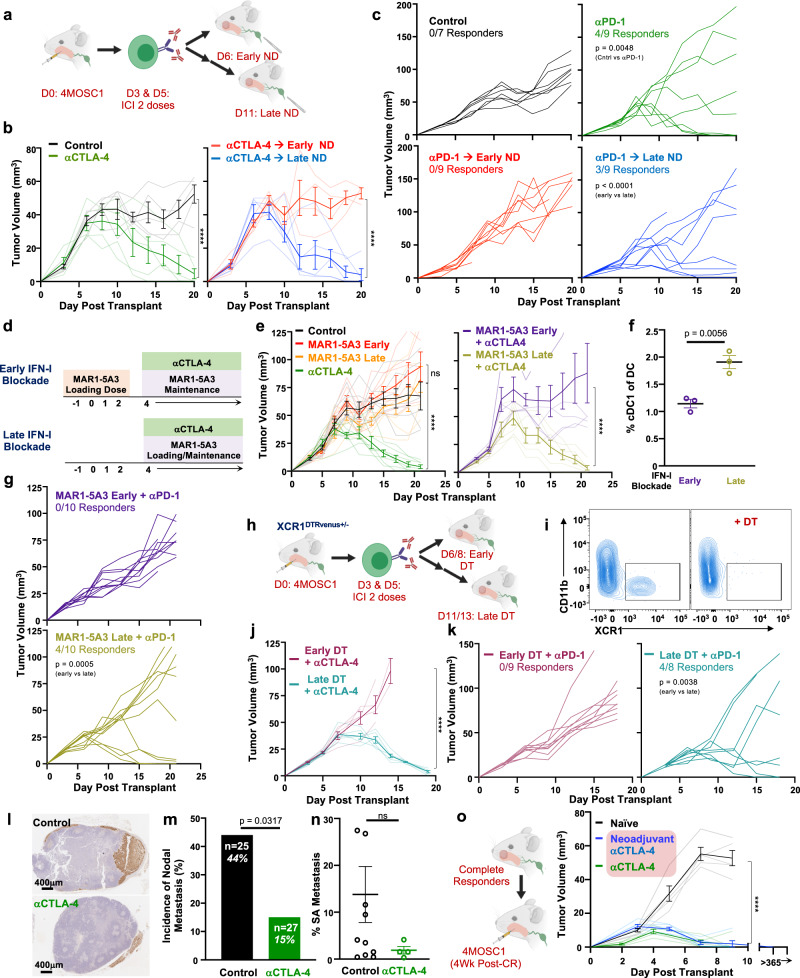
Fig. 5. Rational IO treatment sequencing drives primary tumor treatment responses and immunosurveillance to protect against locoregional nodal metastasis.
a Experimental schema for b, c. b Tumor growth kinetics from 4MOSC1 tumor-bearing control animals (black lines, n = 5) or αCTLA-4-treated animals (green lines, n = 5), followed by either early (red lines, n = 4) or late (blue lines, n = 5) neck dissection. c Tumor growth kinetics from 4MOSC1 tumor-bearing control animals (black lines, n = 7) or αPD-1-treated animals (green lines, n = 9), followed by either early (red lines, n = 9) or late (blue lines, n = 9) neck dissection. d Experimental schema for e, g. e Left: Tumor growth kinetics from 4MOSC1 tumor-bearing control animals (black lines, n = 7) or αCTLA-4 treated animals (green lines, n = 7), early IFNAR blockade animals (red lines, n = 7), or late IFNAR blockade animals (orange lines, n = 7). Right: Tumor growth kinetics from 4MOSC1-tongue tumor-bearing animals treated with αCTLA-4 after receiving early IFNAR blockade (purple lines, n = 6) or late IFNAR blockade (dark yellow lines, n = 7). f Percent cDC1s in the tdLNs of 4MOSC1 tumor-bearing animals treated with αCTLA-4 after receiving early (purple lines) or late (dark yellow lines) IFNAR blockade (n = 3/group). g Tumor growth kinetics from 4MOSC1 tumor-bearing animals treated with αPD-1 after receiving early (purple lines) or late (dark yellow lines) IFNAR blockade (n = 10/group). h Experimental schema for j, k. i Representative flow cytometry plots demonstrating the conditional depletion of cDC1s in αCTLA-4 treated 4MOSC1-tongue tumor-bearing XCR1DTRvenus+/− animals one day after systemic delivery of diphtheria toxin (DT) (representative of n = 5 independent samples/group). j Tumor growth kinetics from 4MOSC1 umor-bearing XCR1DTRvenus+/− animals treated with αCTLA-4 and (purple lines) or late (turquoise lines) DT (n = 3 animals/treatment group). k Tumor growth kinetics from 4MOSC1 tumor-bearing XCR1DTRvenus+/− animals treated with αPD-1 and early (purple lines, n = 9) or late (turquoise lines, n = 8) DT. l Representative immunohistochemical images of tdLNs stained with pan-CK rom 4MOSC1-tongue tumor-bearing animals treated with two doses of αCTLA-4 compared to control, day 11, with; (m) Incidence of metastatic disease in tdLNs (n = 25–27 individual tumor-draining lymph nodes/group); and, (n) Quantification of the burden of metastatic disease among tdLNs with occult nodal disease from 4MOSC1 tumor-bearing animals treated with two doses of αCTLA-4 (n = 4) compared to control (n = 11). o Left: Experimental schema; right: tumor growth kinetics in naive (black lines) or previous complete responders after either six doses (green lines) or two doses of αCTLA-4 (blue lines) (naive n = 5/group; long-term survival, n = 3/group). The differences between experimental groups were analyzed using independent, two-sided Student t tests (f, n), fisher’s exact test (m) or simple linear regression analysis (b, c, e, g, j, k, o). All data represent averages ± SEM, except where indicated. ****P < 0.0001. ns not statistically significant. Source data are provided as a Source Data file.

