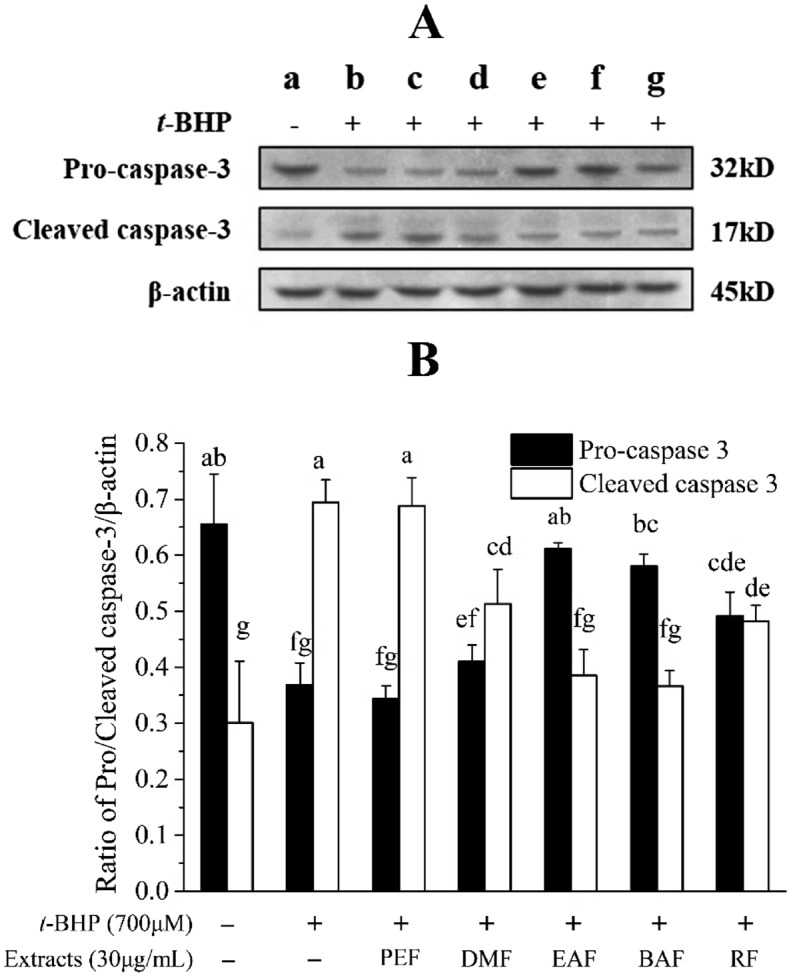
Figure 4.

Effects of extracts on the expression of caspase-3 level in HepG2 cells. HepG2 cells were treated with 30 μg/mL samples for 6 h before being exposed to t-BHP (700 μmol/L) for 3 h. (A) The expressions of pro-caspase-3, cleaved caspase-3 and β-actin were used for normalization and verification of protein loading; (B) Quantitative pro-caspase-3 and cleaved caspase-3 expression after normalization to β-actin. (a) Control; (b) 700 μmol/L t-BHP treated; (c) 30 μg/mL PEF + 700 μmol/L t-BHP; (d) 30 μg/mL DMF + 700 μmol/L t-BHP; (e) 30 μg/mL EAF + 700 μmol/L t-BHP; (f) 30 μg/mL BAF + 700 μmol/L t-BHP; (g) 30 μg/mL RF + 700 μmol/L t-BHP. Different letters above bars indicate significant difference (by ANOVA, p < 0.05). Result are expressed as mean ± SD (n ≥ 3). + , treated; −, untreated.
