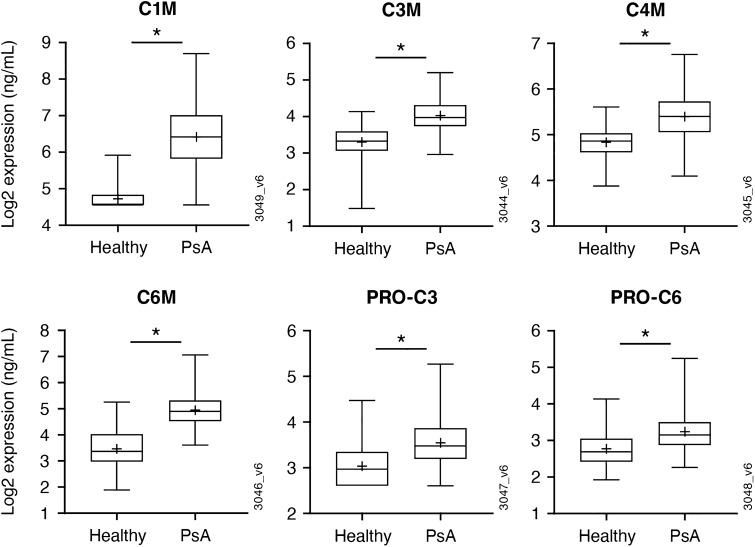
Fig. 1.
Upregulation of collagen degradation and formation biomarkers in the serum of PsA patients (PsA biomarker subset: N = 260) compared to healthy controls (healthy control subset: N = 76). Healthy controls were demographically matched (age and sex) to the PsA biomarker subset. Values are shown as the median (mean is shown as a (plus [+] sign). Boxes represent the interquartile range, while whiskers represent the minimum and maximum values. The asterisk indicates significance defined by a fold change ≥ 1.25 and adjusted (adj) p < 0.05. C1M, C3M, C4M, C6M collagen degradation biomarkers, PRO-C1, PRO-C3 collagen formation biomarkers, PsA psoriatic arthritis

