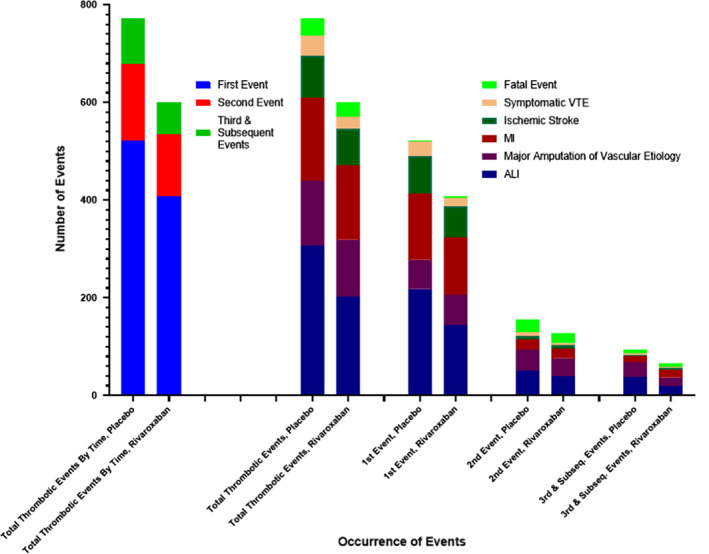
FIGURE 4.

Distribution of total (first and subsequent) arterial and venous thrombotic events. The distribution of first, second, and third and subsequent arterial and venous thrombotic events within the placebo and rivaroxaban‐treated groups is shown, along with the occurrence of the nonfatal outcome components and fatal events
