FIGURE 4.

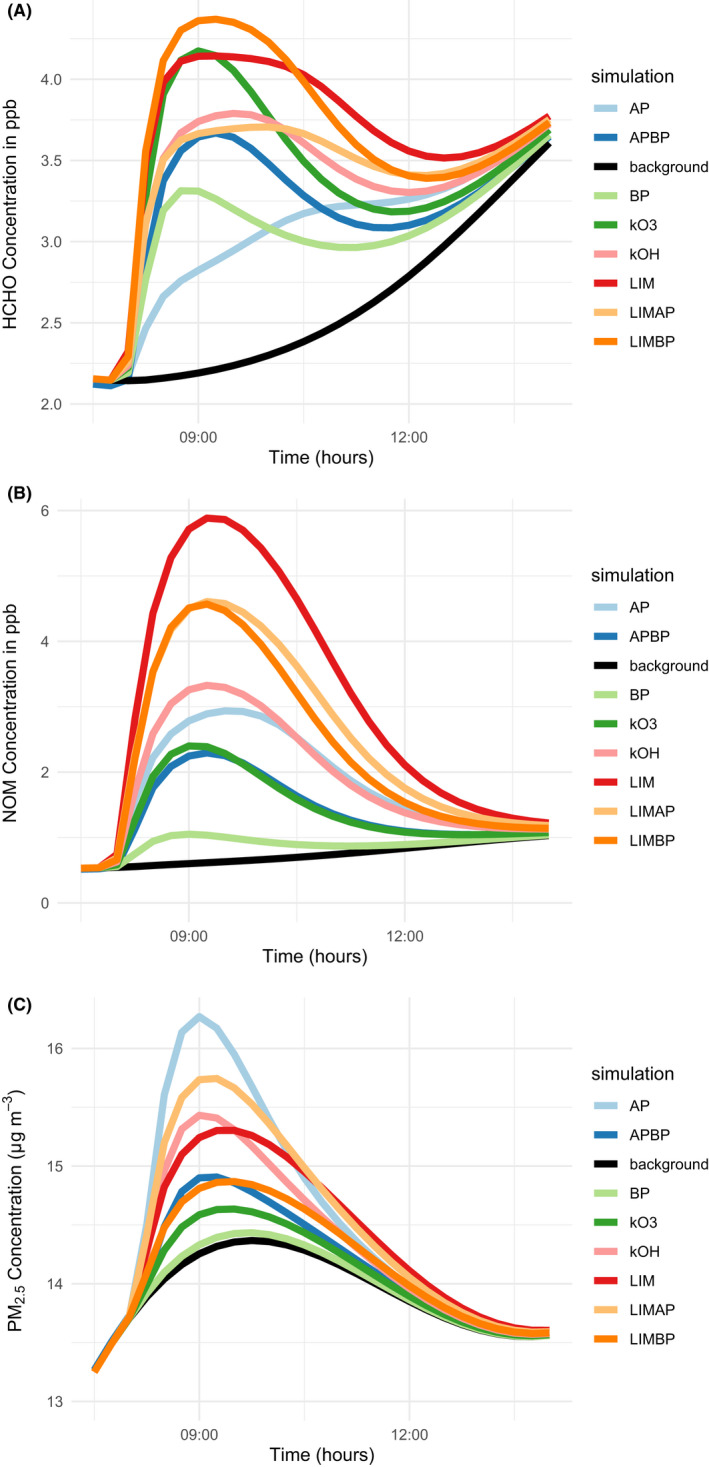
Concentrations of HCHO, nitrated organic material (NOM), and PM2.5 in the upper, middle, and lower plots, respectively, between 07:30 and 14:00 h during the different model simulations

Concentrations of HCHO, nitrated organic material (NOM), and PM2.5 in the upper, middle, and lower plots, respectively, between 07:30 and 14:00 h during the different model simulations