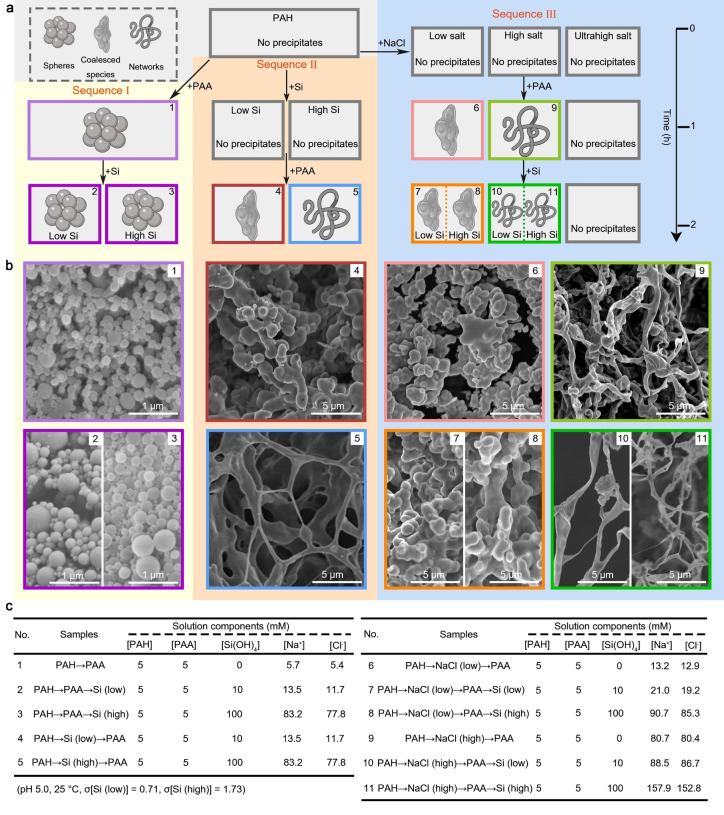
Figure 2.
a) A scheme illustrating the reaction sequences. Each step that yields visible precipitates has a numerical label that is used throughout this manuscript. b) SEM images showing the morphologies of collected samples after centrifugation and lyophilization. c) Nominal concentrations of the components under each experimental reaction. Note that Na and Cl ions originate from the polymer and silicon stock solutions, as well as from the addition of NaCl and pH adjustment.

