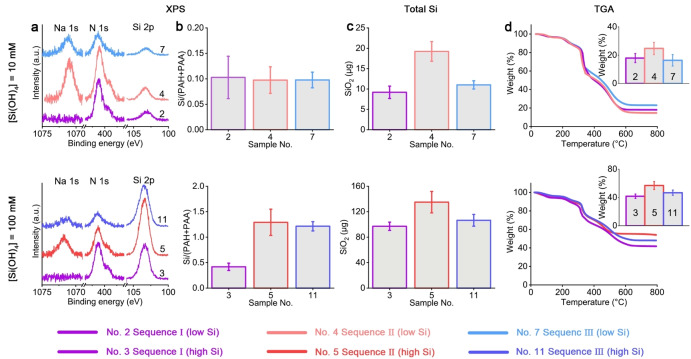
Figure 3.
Chemical composition of the Si‐containing precipitates. a) High‐resolution XPS spectra of the Si 2p, N 1s, and Na 1s regions collected from samples with 10 mM and 100 mM Si. b) Si to total polymer (PAH+PAA) mole ratios derived from XPS data. See Table S2 for detailed elemental compositions. c), d) Bulk composition analyses of total extracted Si (c) and TGA (d, inserts show the inorganics weight fraction). Reaction conditions can be found in Figure 2c according to the sample labels.

