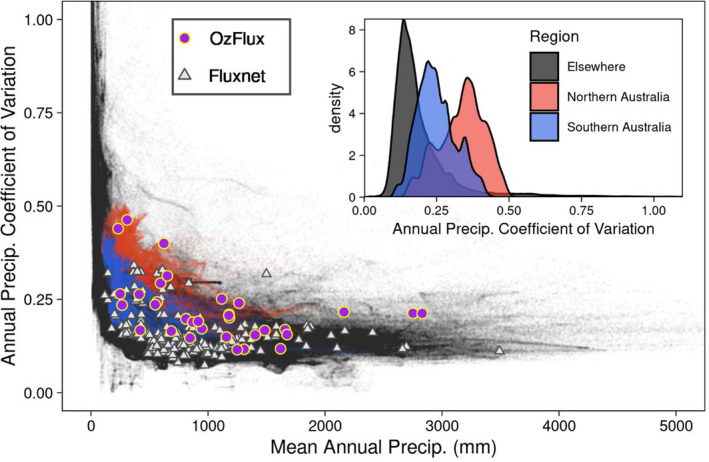
FIGURE 3.

The coefficient of variation of annual precipitation plotted against mean annual precipitation (global gridded data) for the period 1981–2010 with probability distributions showing Northern Australia, Southern Australia, rest of the world (inset). Precipitation data were extracted from the TerraClimate dataset (Abatzoglou et al., 2018) at 0.09° resolution for regions between 60°S and 80°N. For visualisation regions where mean annual precipitation was less than 5 mm yr−1 are removed. Northern (red) and Southern Australia (blue) are differentiated by the 28°S Latitude parallel. The corresponding climates of FluxNet (grey triangle) and OzFlux sites (purple circles) are shown
