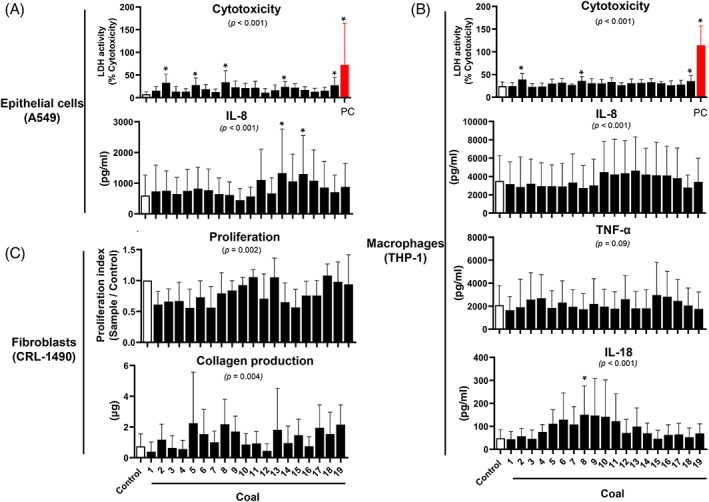
FIGURE 2.

Cellular response. Cytotoxicity and cytokine production were assessed in in A549 (A) and THP‐1 cells (B), while proliferation and collagen production were quantified in CRL‐1490 cells (C) in response to 19 different coal samples. *p <0.05, compared to the control group. The overall ANOVA p‐values are shown in the graph. Values are mean (SD) with n = 6 per group for A549 and n = 7 per group for THP‐1 and CRL‐1490 cells. LDH, lactate dehydrogenase; PC, positive control for LDH assay
