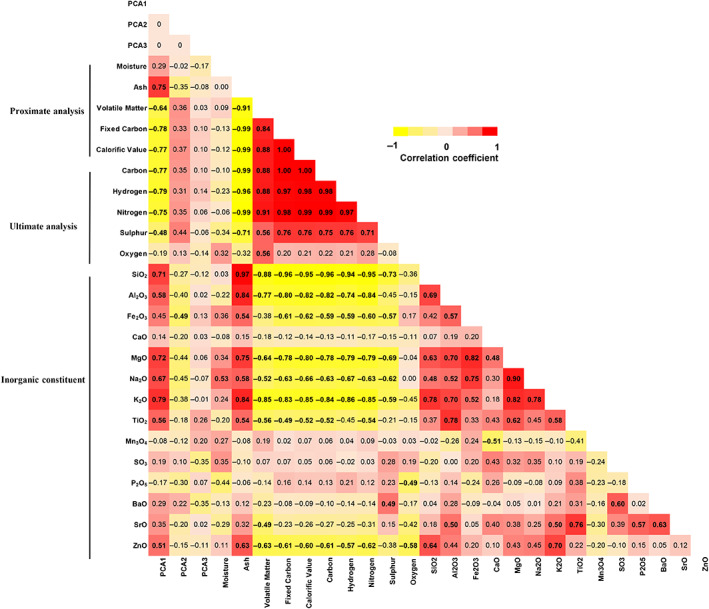
FIGURE 3.

Correlation between particle constituents and cellular response. The correlation matrix shows the correlations between coal compositions and scores PC1, PC2 and PC3 which reflect cell cytotoxicity, the inflammatory response and fibrotic response, respectively. Each cell in the table shows the correlation coefficients between the two variables, with the corresponding colour intensity indicating the strength of the association. Numbers in bold indicate a significant correlation between the two variables (p <0.05). PCA, principal component analysis
