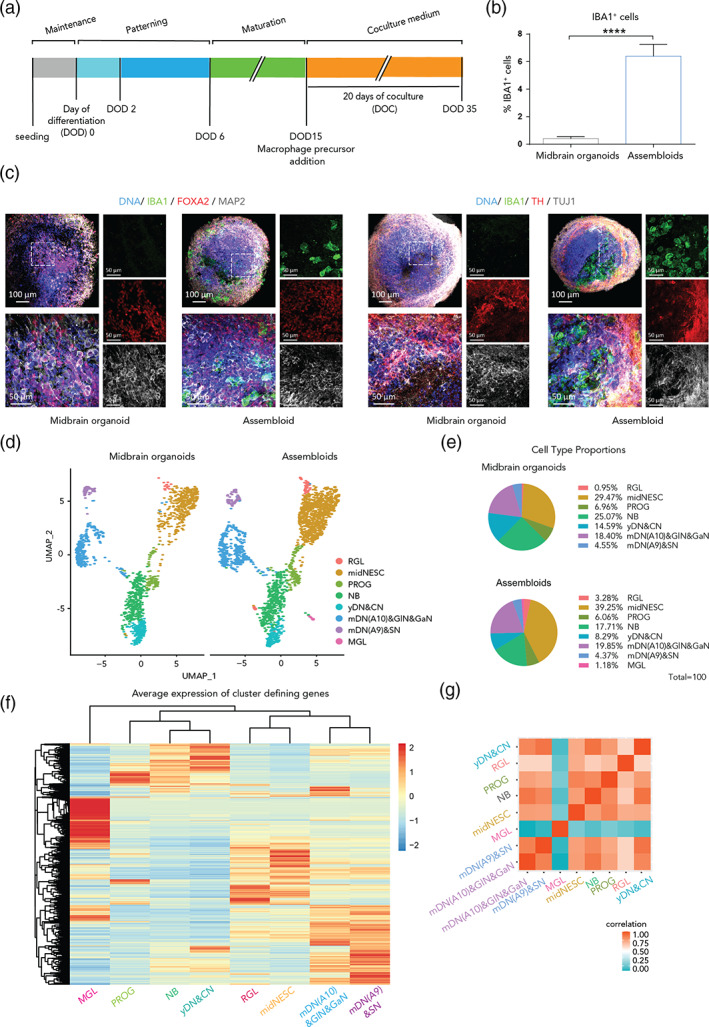
FIGURE 2.

The coculture medium allows a successful microglia integration and seven other neural cell populations in assembloids. (a) Timeline of the coculture of midbrain organoids with macrophage precursors. DOD = day of differentiation, DOC = day of coculture. (b) IBA1 positive (IBA1+) cell percentage in midbrain organoids and assembloids. Assembloids present around 6.4% of IBA1+ cells (n [midbrain organoids] = 5, 5 batches, n [assembloids] = 15, 5 batches, 3 cell lines). Data are represented as mean ± SEM. (c). Immunofluorescence staining of midbrain organoids and assembloids with microglia from the line K7 for IBA1, FOXA2 and MAP2 (left panels), and for TH and TUJ1 (right panels). For lines 163 and EPI see Figure S1H. (d). UMAP visualization of scRNA‐seq data—split by microglial presence—shows eight different defined cell clusters in assembloids. RGL, radial glia; midNESC, midbrain specific neural epithelial stem cells; PROG, neuronal progenitors; NB, neuroblasts; yDN&CN, young dopaminergic and cholinergic neurons; mDN(A10)&gaN&GlN, mature A10 specific dopaminergic neurons, gabaergic and glutamatergic neurons; mDN(A9)&SN, mature A9 specific dopaminergic neurons and serotonergic neurons, MGL, microglia. (e) Proportions of different cell types in midbrain organoids and assembloids. (f) Average expression of cluster defining genes in assembloids. (g). Spearman's correlation between different cell types in assembloids. *p <.05, **p <.01, ***p <.001, ****p <.0001 using a Kruskal‐Wallis one‐way ANOVA with Dunn's multiple comparisons test (for MGLm and cc med vs. MOm), and a Mann–Whitney test (for MGLm vs. cc med) in (a) and (b), and a Mann–Whitney test in (e)
