FIGURE 5.

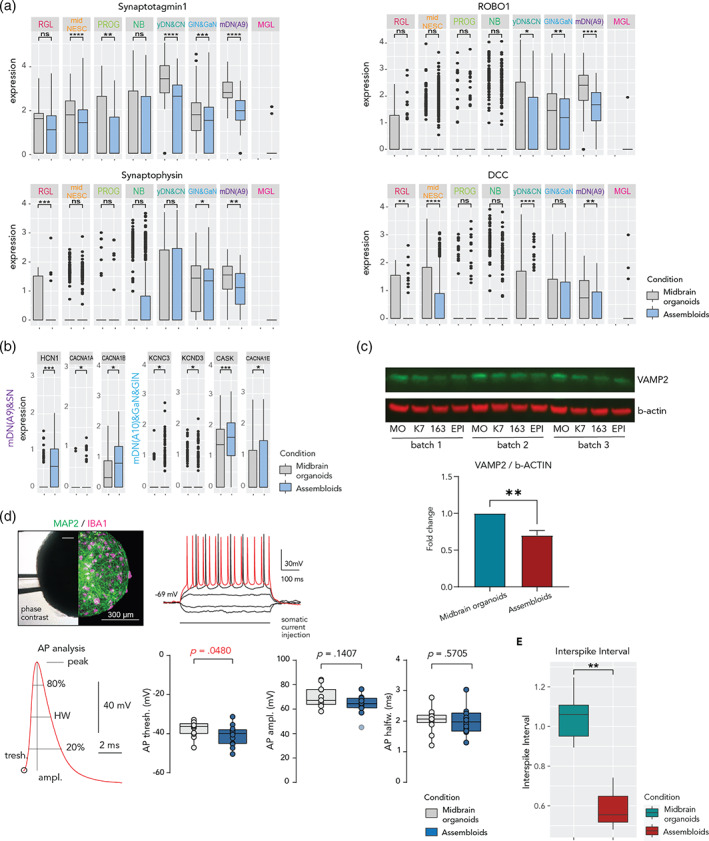
Microglia affect the expression of genes related to synaptic remodeling in assembloids and develop mature electrophysiological characteristics. (a) Gene expression of general synaptic markers such as Synaptotagmin (SYT1) and Synaptophysin (SYP), and the dopaminergic neuron circuit formation genes ROBO1 and DCC across cell clusters in midbrain organoids and assembloids. Data are represented as mean ± SD. *p <.05 using a Wilcox test. Dots represent single cells. (b) Expression of genes involved in action potential (CASK, CACNA1A, CACNA1E, CACNA1B) and active zones (HCN1, KCNC3, KCND3) within synapses in the dopaminergic neuron cluster (mDN(A9)&SN) in midbrain organoids and assembloids. Data are represented as mean ± SD. *p <.05 using a Wilcox test. Dots represent single cells. (c) Western blot showing protein levels of the synaptic vesicle marker VAMP2 and the housekeeping protein β‐actin (upper panels). Bar graph showing the Western blot quantification from the upper panels (n [midbrain organoids] = 3, 3 batches, n [assembloids] = 9, 3 batches, 3 cell lines). **p <.01 using a Mann–Whitney test. Data are represented as mean ± SEM. (d) Fixation of organoid during recording and post hoc verification of microglia presence. The left half shows an infrared phase‐contrast life image with the fixation pipette (upper left panel). The right half shows the same organoid after immunofluorescence staining for MAP2 and IBA1. Example traces show voltage response to hyperpolarizing and depolarizing current injections of a neuron inside an assembloid measured by whole‐cell patch‐clamp. Voltage responses that exhibited action potential (AP) following 50 ms after stimulus onset were used for AP analysis (upper right panel). Analysis of AP waveform characteristics (bottom left panel). Voltage thresholds were significantly more depolarized in assembloid neurons (bottom middle‐left panel, n = 14 neurons in midbrain organoids and n = 13 cells in assembloids), although analysis of AP amplitude (bottom middle‐right panel) and half width (bottom right panel) shows no systematic differences between both groups. Box plots indicate median, 25th, and 75th percentiles and raw data points. Outliers deviating 2.5 SD are marked translucent and were excluded from statistical analysis for normally distributed data. p‐values were determined using unpaired t tests or Mann–Whitney rank test (indicated as p). (e) Multi‐electrode array results showed a lower inter‐spike interval in assembloids compared with midbrain organoids (n [midbrain organoids] = 3, 3 batches, n [assembloids] = 9, 3 batches, 3 cell lines). ***p = .001, **p = .01, *p = .05 using a Wilcox test. Boxes cover data from the first to the third quartile. The whiskers go from each quartile to the minimum or maximum
