Figure 1.

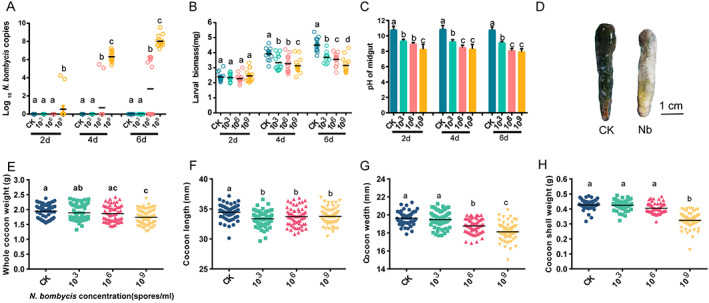
Effect of N. bombycis exposure on silkworms. (A) DNA was extracted from the intestinal epithelium, and the N. bombycis burden was estimated by absolute quantification in gut samples at different times post‐infection (2, 4, and 6 days) (mean with 95% confidence interval, n = 15). (B) Larval masses of the different groups (mean with 95% confidence interval, n = 15 for each group). (C) pH of the silkworm gut. The pH was measured, and the values are shown as the mean ± SE (n = 10). (D) Gut morphology of silkworms infected with N. bombycis after 6 days. (E,H) Whole‐cocoon weight (E), cocoon length (F), cocoon width (G) and cocoon shell weight (H) of normal and N. bombycis‐treated silkworms. CK, healthy silkworm; 103, 106, and 109 groups: N. bombycis treatment (Nb) with 103, 106, and 109 spores/mL concentrations, respectively. Different letters represent significant differences between groups according to Tukey's honestly significant difference (HSD, P < 0.05).
