
Figure 2.
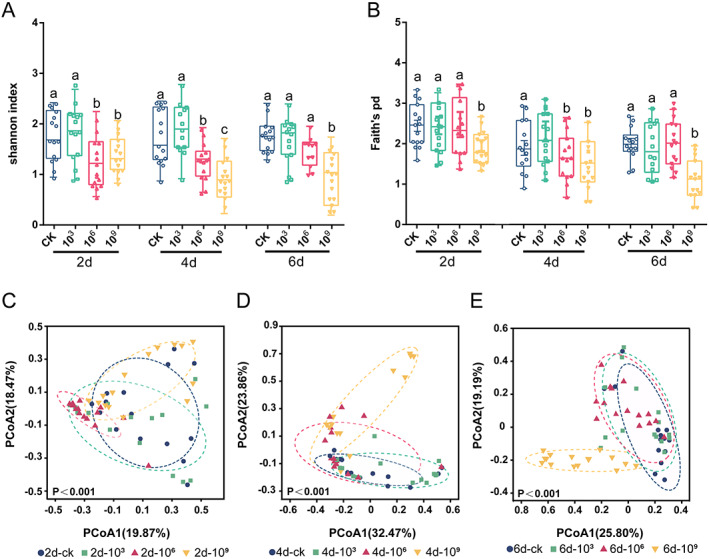
Spatial structure of the B. mori gut microbiota. (A,B) Alpha diversity and (D,E) beta diversity were investigated. Alpha diversity (Shannon and Faith's PD) of bacterial communities (based on ASVs) at different spore concentrations (CK, 103, 106, and 109 spores/mL) and infection times (2, 4, and 6 days). Different letters describe significant differences at P = 0.05. One‐way ANOVA with Tukey's multiple comparisons test and unpaired Student's t test. PCoA plot showing variation in community structure among different infection concentrations [permutational multivariate analysis of variance (PERMANOVA) test with 999 permutations, P > 0.05] based on Bray–Curtis distance. Each point represents an individual sample.