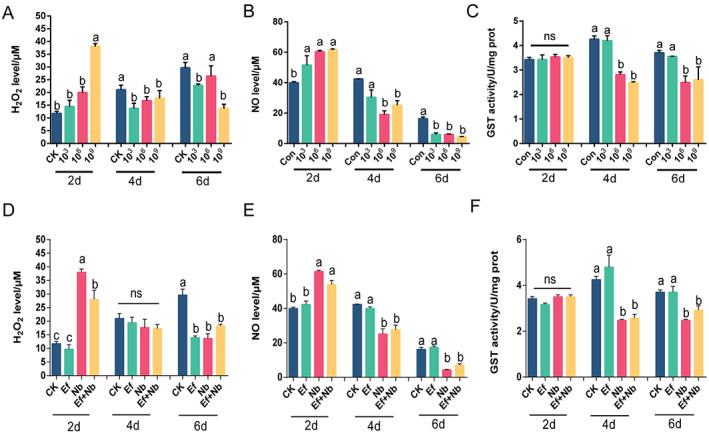
Figure 7.

Hydrogen peroxide (H2O2) and NO levels and GST activity. (A–C) Effect of acute N. bombycis exposure on H2O2 level (A) and NO level (B) and GST activity (C). The vertical axis represents the relative gene expression ratios, and the horizontal axis represents the times (2, 4, and 6 days) and N. bombycis concentrations (CK, 103, 106, and 109 spores/mL). (D–F) H2O2 level (D) and NO level (E) and GST activity (F) after treatment with E. faecalis LX10 (107 spores/mL) (Ef), N. bombycis (109 spores/mL) (Nb), or N. bombycis and E. faecalis LX10 (Ef + Nb). Healthy silkworms were fed the same volume of sterile water as a control (CK). Each bar represents the mean fold‐change ± SE of five independent experiments. Different letters represent significant differences at P < 0.05 (one‐way ANOVA with Tukey's post hoc test).
