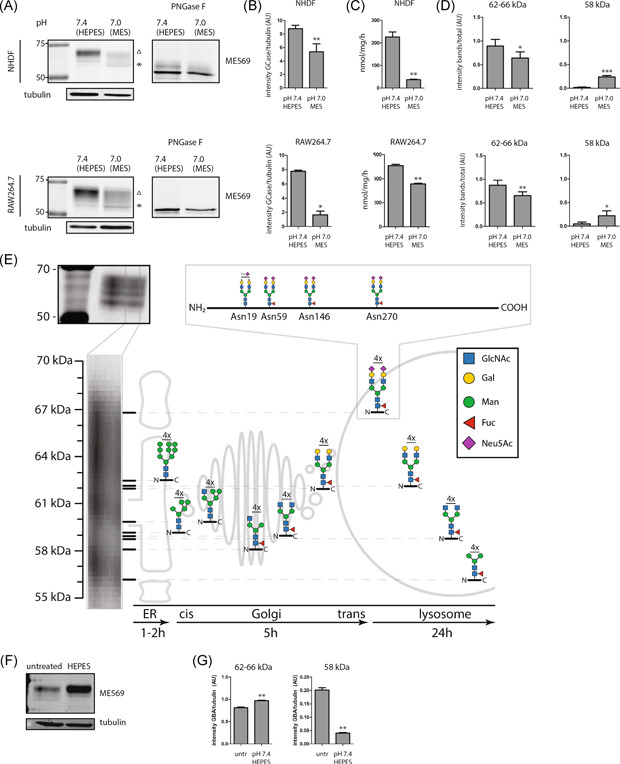
Figure 1.

Impact of medium on cellular GCase glycoforms. (A) GCase in lysates of skin fibroblasts (NHDF) and RAW264.7 cells was labeled with GCase‐specific ABP and subsequently visualized by fluorescence scanning after SDS‐PAGE. Labeled GCase was digested with PNGase F to remove N‐glycans, as described in Section 2. (B) Quantification of total GCase band intensity shown in (A), corrected for tubulin loading control. (C) GCase of the same lysates of skin fibroblasts (NHDF) and RAW264.7 cells was measured with 4‐MU‐β‐Glc substrate as described in Section 2. (D) Quantification of prevalent GCase glycan isoforms shown in (A) defined as 62–66 and 58 kDa, as a proportion of total GCase intensity. (E) Scheme depicting processing of GCase glycoforms (adapted from Aerts, thesis). (F) Comparison of GCase glycan isoforms in lysates of cells cultured in bicarbonate buffered medium with and without supplementation with 50 mM HEPES. (G) Quantification of prevalent GCase glycan isoforms shown in (F) defined as 62–66 and 58 kDa, as a proportion of total GCase intensity. Significance (independent t‐test) is indicated by asterisks, **p ≤ 0.01. (A, E) ∆ indicates the 62–66 kDa isoforms, * indicates the 58 kDa isoform. 4‐MU‐β‐Glc, 4‐methylumbelliferyl substrate beta‐d‐glucopyranoside; ABP, activity‐based probe; ER, endoplasmic reticulum; HEPES, 4‐(2‐hydroxyethyl)‐1‐piperazineethanesulfonic acid; MES, 2‐(N‐morpholino)ethanesulfonic acid; NHDF, normal human dermal fibroblast; SDS‐PAGE, sodium dodecyl sulfate‐polyacrylamide gel electrophoresis
