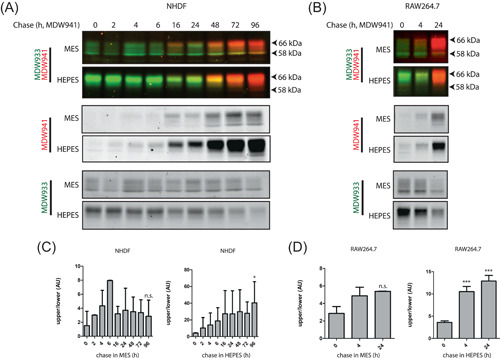
Figure 3.

Visualization of GCase isoforms with two distinct ABPs: reduced glycan maturation in HEPES‐containing medium. (A) Pulse‐chase experiments with fibroblasts, performed as described in Section 2. Following prelabeling with MDW933 (green fluorescent, existing GCase), cells were incubated continuously with MDW941 (red fluorescent, newly synthesized GCase) for indicated time periods. Cells were harvested and labeled GCase was visualized following SDS‐PAGE. (B) Same experimental setup was used for GCase studies in RAW264.7 cells. (C) Quantification of band intensity shown in (A) depicting the ratio of newly formed GCase (MDW941) glycan isoforms 62–66 (upper) over 58 (lower) kDa in MES (left) and HEPES (right). (D) Quantification of band intensity shown in (B) depicting the ratio of newly formed GCase (MDW941) glycan isoforms 62–66 (upper) over 58 (lower) kDa in MES (left) and HEPES (right). Overall significance of treatment effect (one‐way ANOVA, Tukey post hoc) is indicated by graph‐wide asterisks, individual asterisks on bars indicate significance compared to t = 0 (A) or HEPES (B); *p ≤ 0.05, **p ≤ 0.01, ***p ≤ 0.001. ABP, activity‐based probe; ANOVA, analysis of variance; HEPES, 4‐(2‐hydroxyethyl)‐1‐piperazineethanesulfonic acid; MES, 2‐(N‐morpholino)ethanesulfonic acid; NHDF, normal human dermal fibroblast; SDS‐PAGE, sodium dodecyl sulfate‐polyacrylamide gel electrophoresis
