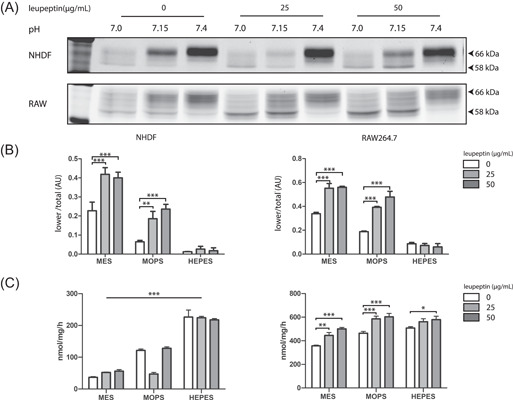
Figure 5.

Inhibition of lysosomal cathepsins increases GCase in cells exposed to MES and MOPS, but not those exposed to HEPES. Cells (fibroblasts and RAW264.7) were cultured in the presence of 50 mM buffer compound (MES, MOPS, or HEPES) in the absence or presence of 0, 25, or 50 µg/ml leupeptin for 48 h. Cells were harvested and GCase in lysates was visualized by (A) ABP labeling, SDS‐PAGE, and fluorescence scanning. (B) Quantified intensity of GCase glycan isoforms 58 kDa of bands depicted in (A), corrected for total GCase (total). (C) Enzymatic GCase activity measurements (as described in Section 2) of same lysates. Overall significance of interaction (two‐way ANOVA) is indicated by graph‐wide asterisks, individual asterisks on bars indicate significance (Bonferroni post hoc) compared to 0 µg/ml leupeptin, *p ≤ 0.05, **p ≤ 0.01, ***p ≤ 0.001. ABP, activity‐based probe; ANOVA, analysis of variance; HEPES, 4‐(2‐hydroxyethyl)‐1‐piperazineethanesulfonic acid; MES, 2‐(N‐morpholino)ethanesulfonic acid; MOPS, 3‐(N‐morpholino)propanesulfonic acid; NHDF, normal human dermal fibroblast; SDS‐PAGE, sodium dodecyl sulfate‐polyacrylamide gel electrophoresis
