Figure 1.

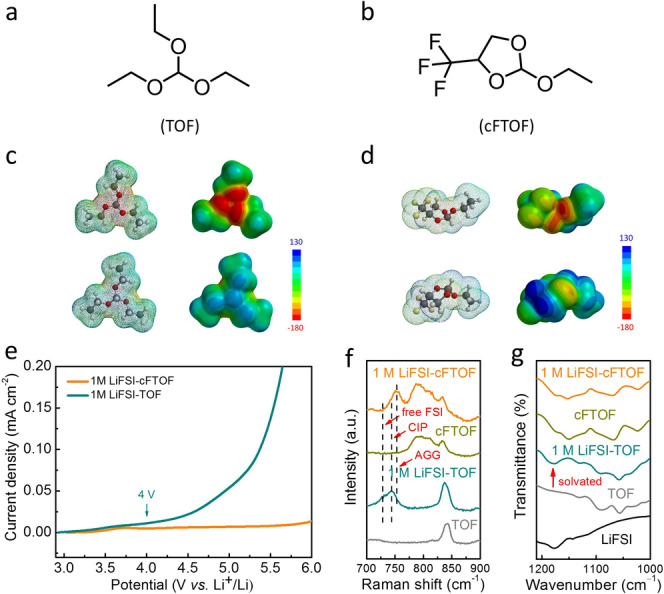
a, b) Molecular structures of solvents, TOF and cFTOF. c, d) Electrostatic potential map (ESP) comparisons of TOF and cFTOF with different views. The ESP scale bar is the electrostatic potential range (kJ mol−1). e) Oxidation stability of two electrolytes in Li|Al half cells tested by LSV. f) Raman spectra of 1 M LiFSI‐cFTOF and 1 M LiFSI‐TOF electrolytes. g) FT‐IR spectra of 1 M LiFSI‐cFTOF and 1 M LiFSI‐TOF electrolytes.
