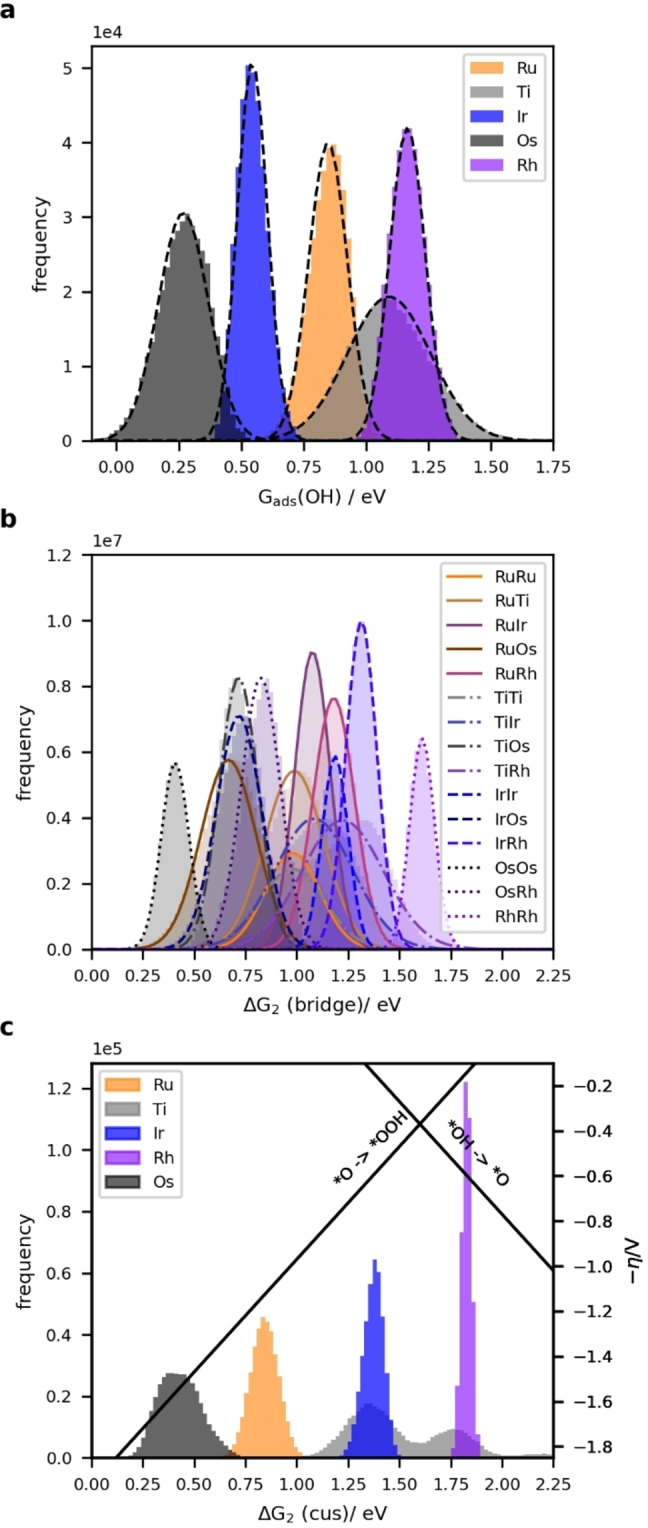
Figure 4.

Distribution of energies for a) adsorption of *OH on all possible cus sites, b) ΔG 2 on all possible bridge sites and c) ΔG 2 on all possible cus sites as calculated with the fitted model. Gaussian fits to each distribution are drawn in a, b, as guide to the eye. Black lines in c) indicate the volcano defined by the conventional scaling relation.
