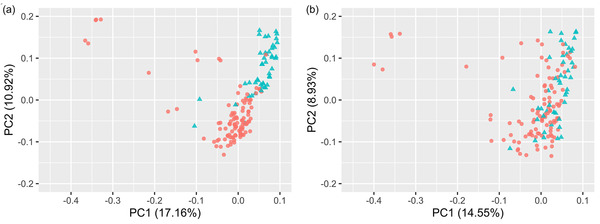
FIGURE 2.

Population subsubstructure in the association mapping panel of 150 accessions, based on (a) all markers (n = 16,801), and (b) skimmed markers (n = 463; linkage disequilibrium threshold R2 = .2). Markers with a minor allele frequency >0.05 were used for both analyses. The presence or absence of the chromosome 1B/1R wheat/rye chromosomal substitution is indicated by red circles and blue triangles, respectively. PC, principal component
