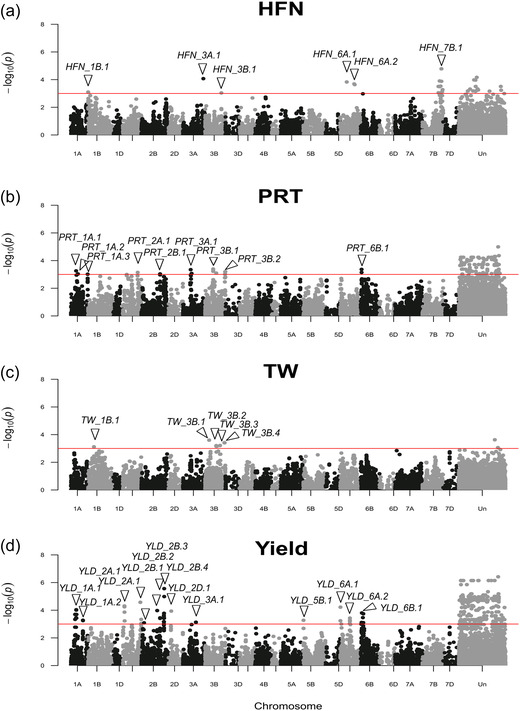
FIGURE 3.

Manhattan plots of genome‐wide association studies for Hagberg falling number (HFN; a), protein content (PRT; b), test weight (TW; c), and grain yield (Yield; d). Markers are shown in genetic map order, according to the genetic map published by Wang et al. (2014). Unmapped markers are not shown here but are listed in Supplemental Table S5. The significance threshold (−log10 P = 3) is indicated by the horizontal red line
