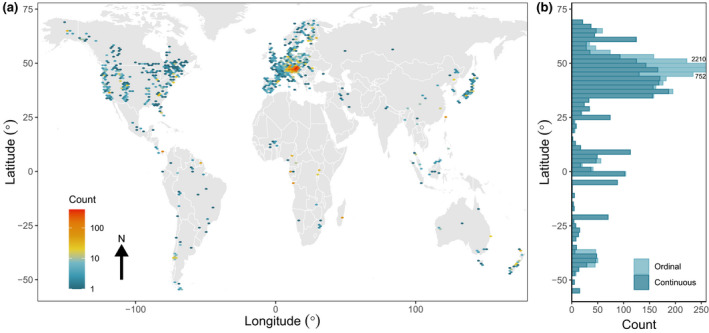
FIGURE 2.

The geographical distribution of time‐series within MASTREE+. The (a) spatial and (b) latitudinal distribution of species‐specific time‐series. For (b), series are stacked and coloured according to the variable type (Continuous, Ordinal). Plotting of counts for ordinal data in the northern mid‐latitudes are truncated due to high sampling intensity in central Europe. Unprojected map, datum = WGS84
