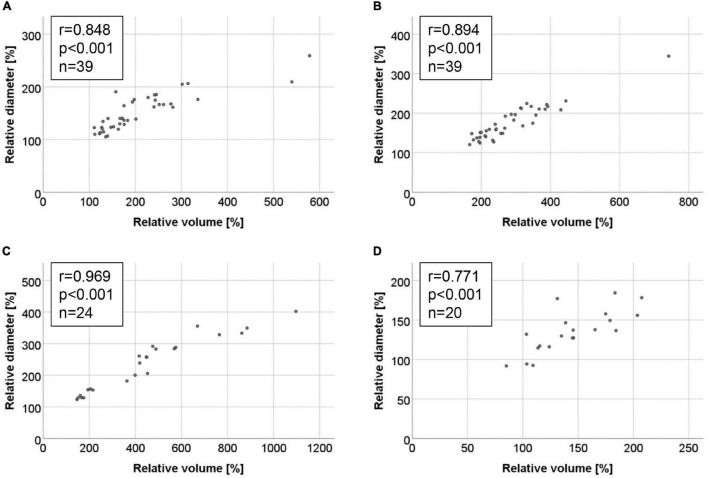
FIGURE 6.
Correlations between relative increase in aneurysm volume and maximum aortic diameter in the four AAA mouse models. Correlations are illustrated by scattergram for the (A) AngII model, (B) ePPE model, (C) ePPE + BAPN model, and (D) PPE model. Baseline values were set to 100% and are hence excluded from the graph and Spearman coefficient of correlation.

