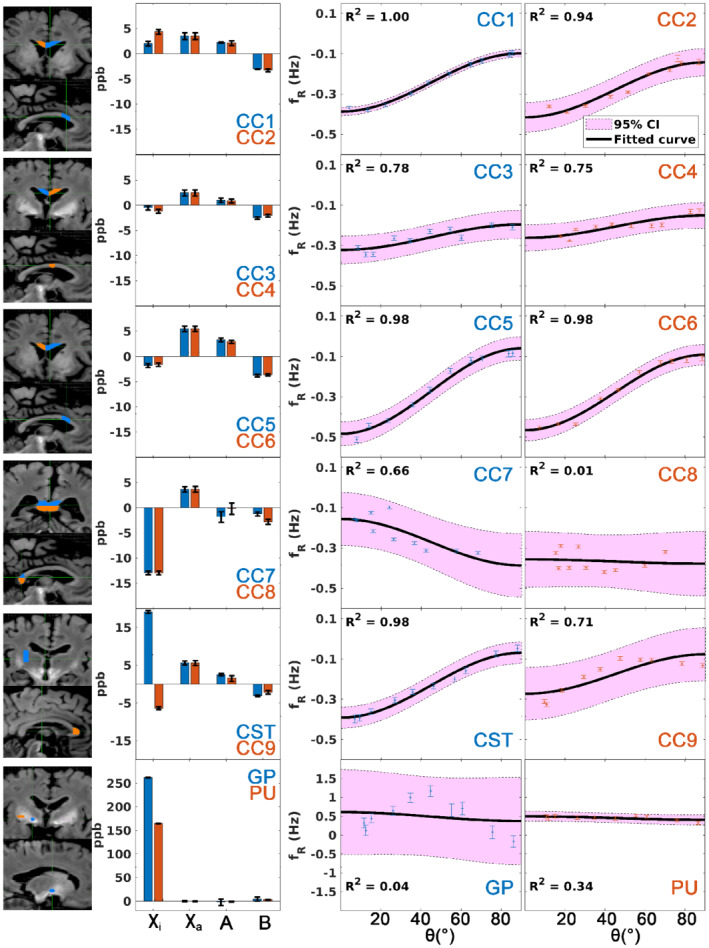
FIGURE 3.

(From left to right) The corresponding regions of interest of the excised specimens in the whole‐brain R1 map (colors match the results on the right); bar plots of the isotropic and anisotropic magnetic susceptibility and coefficients A and B of the fitting of sin2 θ; and sin2 θ fittings that reflect microstructure compartmentalization of the excised specimens. Each row shows the results of two specimens. Error bar indicates the SEM (except for the coefficients A and B in the bar plots, which represents the 95% confidence interval [CI] in this case). The shaded region in the sin2 θ fittings corresponds to the 95% CI. Abbreviations: CC, corpus callosum; CST, corticospinal tract; GP, globus pallidus; PU, putamen
