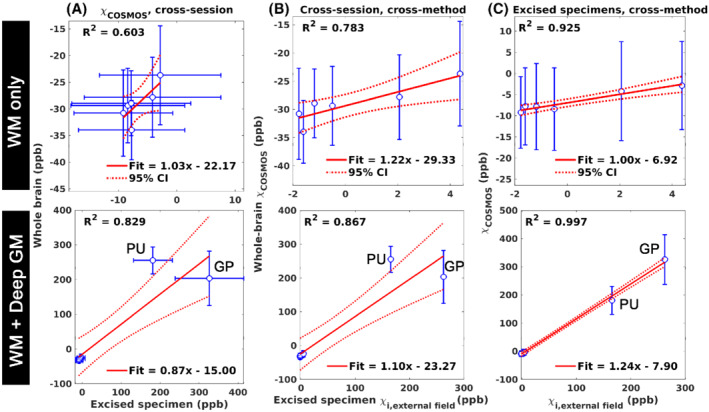
FIGURE 4.

Linear regression analyses with (top) only the six white matter (WM) specimens and (bottom) when the deep gray‐matter (GM) specimens are included. The magnetic susceptibility measured between two imaging sessions using COSMOS (A), between the bulk magnetic susceptibility measured by COSMOS in the first session and the χi from the external field measurement in the second session (B), and the excised specimens between COSMOS magnetic susceptibility and external field derived χi (C). Blue dots: measurement data; solid red line, fitted line; dashed line, 95% CI; error bar, SD
