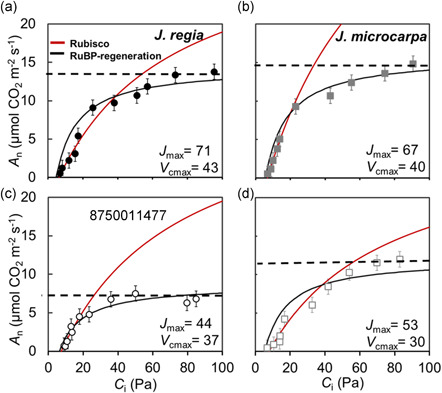
Figure 4.

Photosynthetic CO2 response curves, relationship between mean A n (net assimilation rate) and C i (intercellular airspace CO2 concentration) at 1500 µmol m−2 s−1 photosynthetic photon flux density were constructed using FvCB model (Sharkey, 2016), averaged over four replications in Juglans regia (panels a and c) and Juglans microcarpa (panels b and d) under well‐watered (solid symbols and top row) and dehydrated (empty symbols and bottom row) treatments (±SE; n = 4). Assimilation rate at saturating CO2 (A max), Rubisco and RuBP regeneration limitations are indicated for each species [Color figure can be viewed at wileyonlinelibrary.com]
