Figure 6.

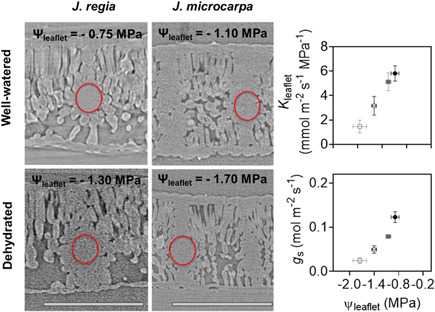
Leaflet water potential (Ψleaf, MPa) and leaflet hydraulic conductance (K leaflet, mmol m−2 s−1 MPa−1) (a) and stomatal conductance (g s, mol m−2 s−1) (b) relationship under well‐watered (solid) and dehydrated (empty) treatments in Juglans regia (circle) and Juglans microcarpa (square). MicroCT images on the left are representative slices comparing conduit embolism from scans of J. regia and J. microcarpa leaves under well‐watered and dehydrated conditions. Six slices from each microCT scan were used to count number of emboli per secondary and tertiary veins under well‐watered and dehydrated conditions. Number of emboli divided by number of veins within the red circles region did not show a significant change in either secondary or tertiary veins under dehydration from well‐watered condition. Bar equals 250 μm [Color figure can be viewed at wileyonlinelibrary.com]
