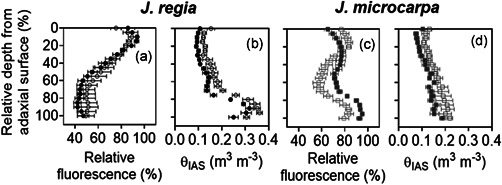
Figure 8.

Chlorophyll fluorescence profiles obtained from epi‐illumination (490 nm) and porosity profiles acquired from microCT scans in Juglans regia (circles) and Juglans microcarpa (squares) under well‐watered (solid) and dehydrated (empty) treatments (mean ± SE; n = 4–6)
