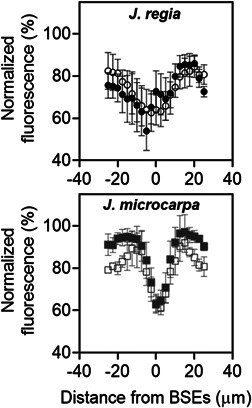
Figure 11.

Fluorescence percentage normalised using maximum values per sample using epi‐illumination. It indicates the spatial distribution of fluorescence in equal horizontal distance from bundle sheath extensions (BSEs) in Juglans regia (circles—left data panel) and Juglans microcarpa (squares—right data panel) under well‐watered (solid) and dehydrated (empty) treatments (±SE; n = 4). Positive and negative values present variation in grayscale values at right or left side of BSEs. BSEs location is designated with white arrows; mean J. regia BSE width was ~4.7–5.0 μm and mean J. microcarpa BSE width was ~3.0–3.5 μm. Zero on the x‐axis of the data plots represents the centre of the measured BSE
