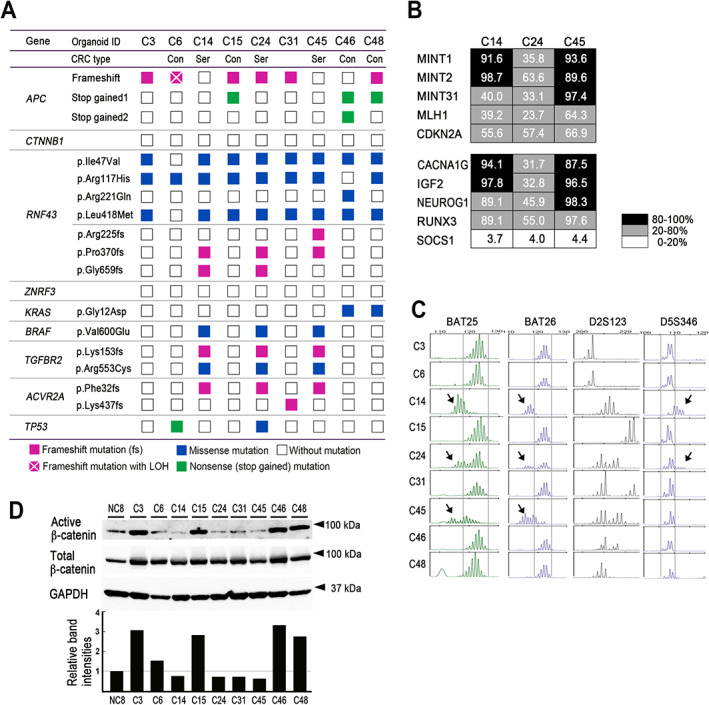
Figure 2.

Genetic characterization and β‐catenin activation of CRC‐derived organoid lines. (A) Mutations of the CRC driver genes identified in the respective CRC‐derived organoid lines. The variants of mutations are indicated. Con, conventional pathway CRC; Ser, serrated pathway CRC. (B) The results of CIMP analyses for classic CIMP markers (top) and new CIMP markers (bottom). The methylation levels for each marker in C14, C24, and C45 cells are indicated as a heatmap. (C) The results of microsatellite instability (MSI) marker analyses in BAT25, BAT26, D2S123, and D5S346. Arrows indicate different patterns from other organoid lines. (D) Immunoblotting results for active β‐catenin and total β‐catenin in the respective organoid lines (top). GAPDH was used as an internal control. Normalized band intensities relative to the NC8 level are indicated in the bar graph (bottom).
