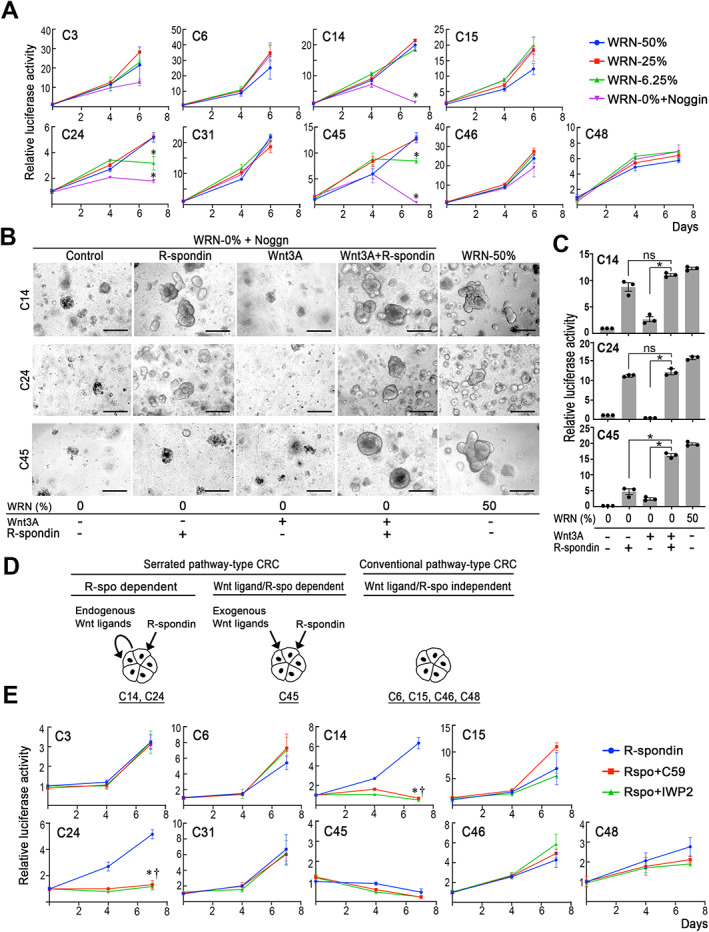
Figure 3.

Wnt ligand and R‐spondin dependency of RNF43 frameshift mutant organoids. (A) Relative cell proliferation, as examined by the luciferase activity of the respective organoids cultured at various concentrations of WRN‐CM, is indicated by line graphs (mean ± SD). A two‐sided t‐test was used to calculate statistical significance. *p < 0.05 versus WRN‐50%. (B) Representative photographs of the respective organoids. Culture conditions are indicated below the photographs. Bars: 250 μm. The images are representative of n = 3 independent experiments. (C) Relative cell proliferations, as examined by the luciferase activity of organoids cultured under the indicated medium conditions relative to those at control (WRN‐0%), are shown in bar graphs (mean ± SD). Individual data are indicated with dots. A two‐sided t‐test was used to calculate statistical significance. *p < 0.05; ns, not significant. (D) Schematic drawing of Wnt ligand and R‐spondin dependency for R‐spondin and endogenous Wnt ligand‐dependent serrated pathway‐type CRC (C14 and C24) (left), R‐spondin and exogenous Wnt ligand‐dependent serrated pathway‐type CRC (C45) (center), and conventional pathway‐type CRC (C6, C15, C46, and C48) (right). (E) Relative cell proliferation, examined by the luciferase activity of the respective organoids cultured in the presence or absence of PORCN inhibitors (C59 or IWP2), is indicated by line graphs (mean ± SD). A two‐sided t‐test was used to calculate statistical significance. Asterisks (for R‐spo + C59) and daggers (for R‐spo + IWP2), p < 0.05 versus R‐spondin only (no inhibitor) control (blue lines).
