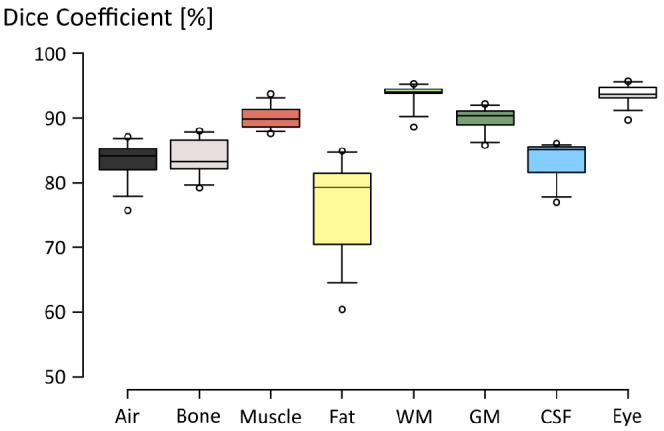
FIGURE 4.

Boxplot diagram showing the Dice coefficients obtained in the cross‐validation study (N = 10). Center lines indicate median values, box limits indicate 25th and 75th percentiles, whiskers extend to 5th and 95th percentiles and outliers are represented by dots
