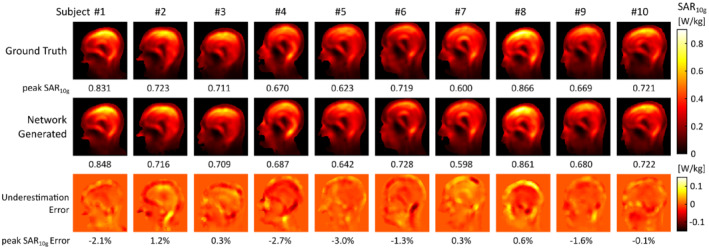
FIGURE 6.

Quadrature birdcage local SAR assessment. Shown are simulated SAR10g distributions in ground truth (top) and network‐generated body models (middle), and corresponding underestimation error maps (bottom). Figure footers denote peak SAR10g values (top, middle) and the corresponding relative underestimation (bottom). Positive errors indicate a peak SAR10g underestimation in the network‐generated model
