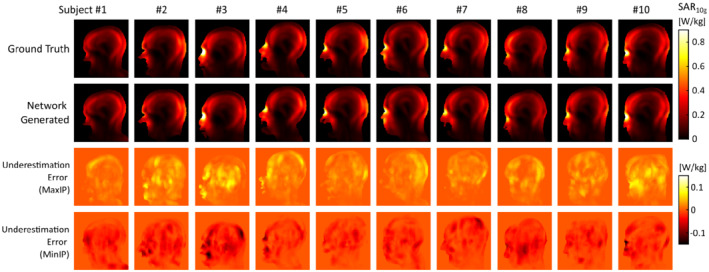
FIGURE 7.

PTx local SAR assessment. Shown are maps of the maximum SAR10g value obtained in the evaluation of 1000 random RF shims in the ground truth (top) as well as network‐generated models (middle), and projections of the SAR10g underestimation and overestimation (bottom). Positive errors indicate SAR10g underestimation in the network‐generated model
