
FIGURE 2.
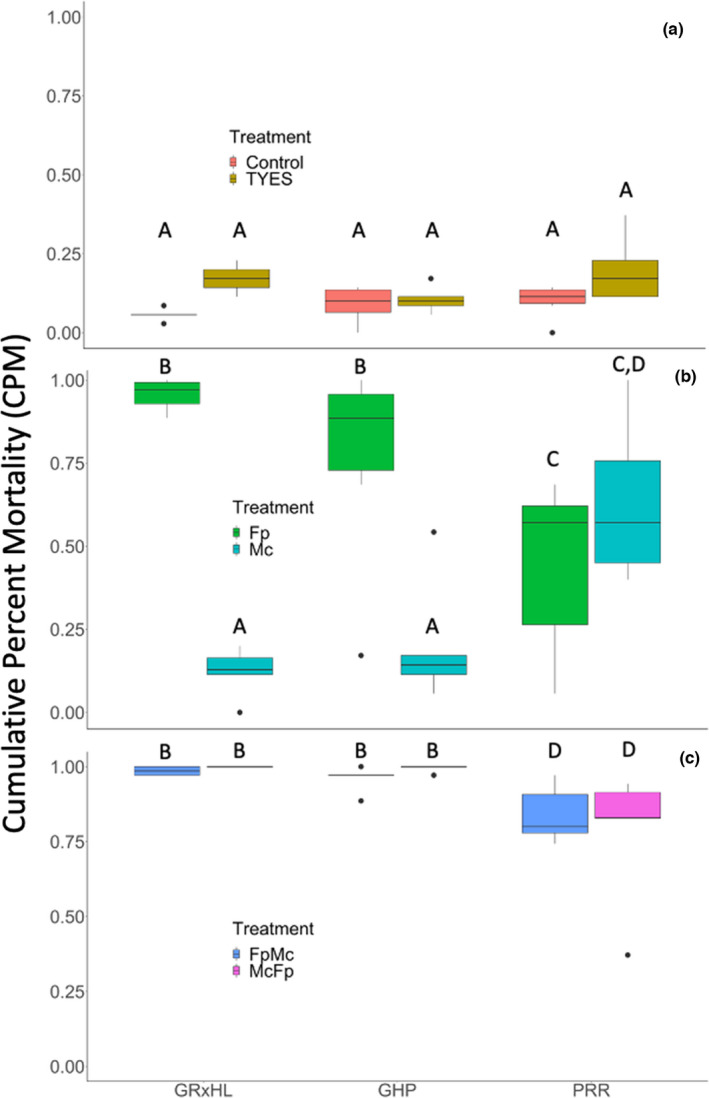
Cumulative per cent mortality (CPM) by strain and treatment at the end of Experiment 1. (a) Control and mock injection (TYES), (b) Flavobacterium psychrophilum only (Fp) and Myxobolus cerebralis only (Mc), and (c) F. psychrophilum followed by M. cerebralis (FpMc) and M. cerebralis followed by F. psychrophilum (McFp). Black lines within the boxes indicate the median of the distribution. Box and whisker plots with the same letter indicate no significant differences and box and whisker plots with different letters indicate statistically significant differences