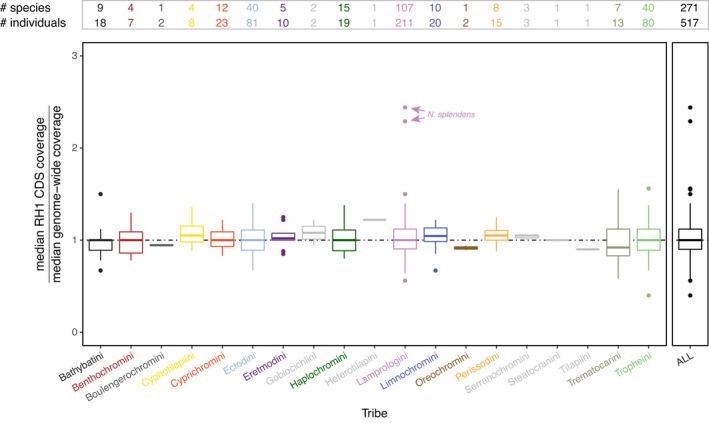
FIGURE 1.

Coverage of mapped read estimates. Boxplots showing the median coverage in the CDS (coding sequence) of the rhodopsin (RH1) gene over an estimate of the median genome‐wide coverage in the cichlid fauna of Lake Tanganyika (LT) as well as in outgroup taxa. Boxplots are shown for each cichlid tribe separately and for the entire data set (ALL); the cichlid tribes occurring in LT are colour‐coded as in Ronco et al. (2021). The boxes’ centre lines show the median, box limits show first and third quartiles, and whiskers show 1.5× the interquartile ranges. Outliers are represented by dots. The horizontal dashed line in black is set to 1 (equal coverage across the whole genome). The number of species and individuals for each tribe is reported at the top. Note that the two genomes of Neolamprologus splendens (marked with arrows) show elevated ratios, which we interpret as artefacts (see Section 3.2 Rhodopsin copy number)
