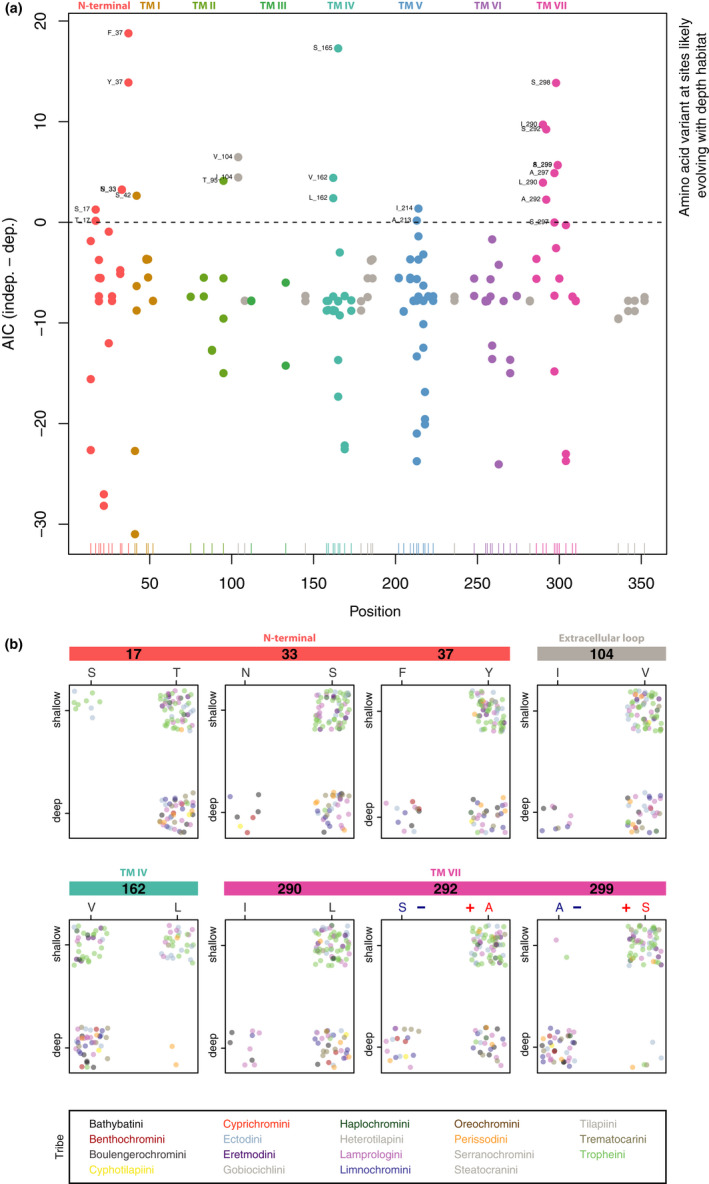
FIGURE 5.

Depth‐related substitution analysis of rhodopsin (RH1) amino acid sites. (a) Dotplots of bayestraits results. Each dot corresponds to the difference in AICs of the independent model and the dependent model (absence/presence of an amino acid at a specific site in RH1 and depth at which species occur) and is colour‐coded according to the RH1 regions (TM: transmembrane alpha‐helix; see Figure 4). The x‐axis shows the positions along the RH1 protein sequence, and the y‐axis shows the difference in AICs between the two models. The horizontal dashed line is fixed at zero, meaning that dots above this threshold indicate those amino acids that are associated with the water depth at which a species occurs (shallow‐ vs. deep‐water living species). (b) Dotplots of sites with exactly two amino acid variants associated with water depth (colour‐coded as in (a)). Each individual is represented by a single dot, colour‐coded according to tribe. The x‐axis represents the amino acid variants, and the y‐axis represents the shallow‐ and deep‐water living species (plotted with jitter points and without ambiguous amino acid sites for better visualization). Note that sites 292 and 299 are among the known key tuning sites in RH1, with substitutions predicted to shift the peak spectral sensitivity (the blue “–“ symbol indicates a predicted shift towards shorter wavelengths, and the red “+” indicates a predicted shift towards longer wavelengths). An extended version of this figure showing all identified sites is provided as Figure S8
