
FIGURE 3.
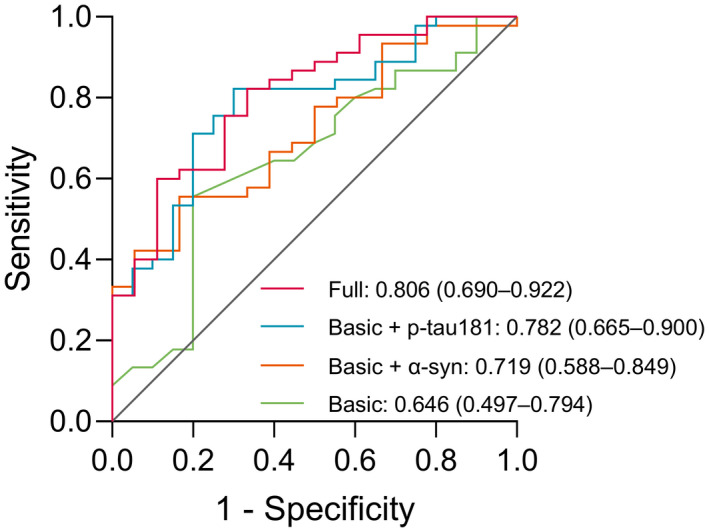
Receiver operating characteristic curves (ROC) for distinguishing Parkinson’s disease (PD) patients (n = 45) from healthy controls (n = 20). The AUC and 95% confidence interval for the ROC analysis are presented for the four models: (a) basic (age and sex): Green line; (b) basic + α‐syn: Orange line; (c) basic + p‐tau181: Blue line; and (d) full (age, sex, α‐syn, and p‐tau181): Red line. “N” refers to the number of plasma samples. α‐syn, α‐synuclein; p‐tau181, phosphorylated tau 181