Figure 5.

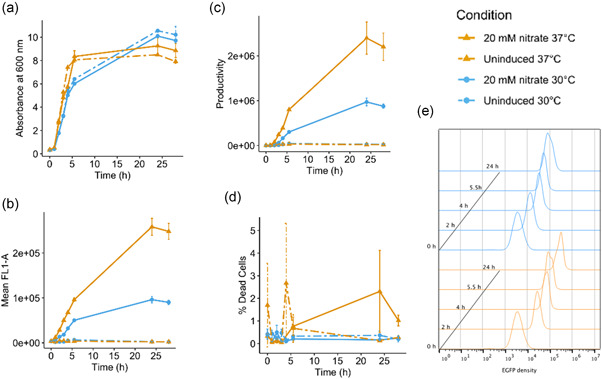
Analysis of 6His‐GFP expression from the narG CC(−40.5) promoter in E. coli JCB387N11 cells at 30 or 37°C. The figure shows the (a) growth, (b) mean GFP fluorescence measured by flow cytometry, (c) productivity (green fluorescence multiplied by OD600), and (d) percentage dead cells of 50 ml JCB387N11 (ΔnarG) cultures expressing 6His‐GFP, using the narG CC(−40.5) promoter. Cells were grown in minimal salts media at either 30°C (blue) or 37°C (orange) for 25 h. Recombinant protein production was initiated by the addition of sodium nitrate to a final concentration of 20 mM, as cells reached an OD600 of ~0.6. Values represent the average values from duplicate flasks and error bars represent ±SD. (e) Flow cytometry analysis of green fluorescence from cells expressing 6His‐GFP grown and induced at either 30°C (blue) or 37°C (orange). Data are plotted as histograms showing the number of cells with different green fluorescence (FL1‐A) values.
