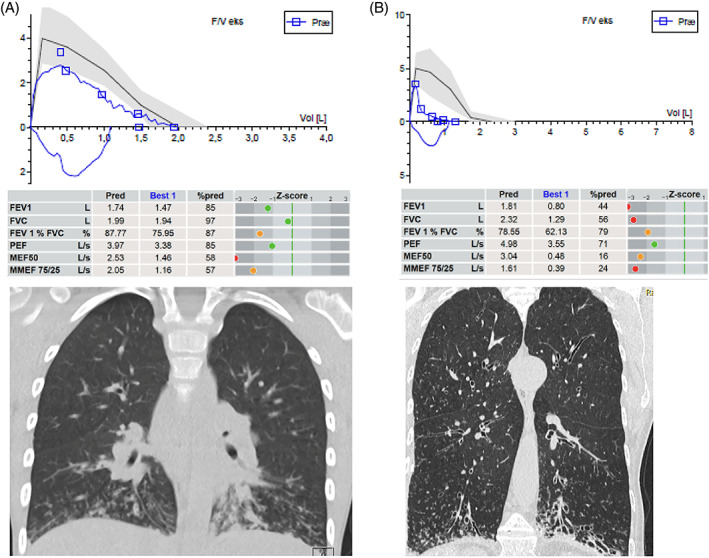
FIGURE 2.

Lung function and structural damage in two patients with primary cilia dyskinesia (PCD) at opposite ends of the age spectrum. Upper parts show flow‐volume curves from forced expiratory maneuvers with airway flow on the Y‐axis in liters per seconds (L/s) and volume on x‐axis in liters (L). Blue loops are the patients' actual performances, while the black line is the predicted/expected ideal flow‐volume loop (gray zone the reference interval). Tables in the middle displays predicted and best performance values of forced expired volume in first second (FEV1), forced expired vital capacity (FVC), FEV1/FVC%, peak expired flow (PEF), maximal (mid‐)expiratory flow at 50% of expired FVC, and maximal mid‐expiratory flow between 25 and 75% of expired FVC (MMEF 75/25). Z‐scores are displayed as green dots when values are within normal range etc. HRCT scans in the bottom show mucus plugging and “tree in bud” appearance to the left, while the right image demonstrates bilateral severe and multiple bronchiectasis at multiple locations but as typically seen in PCD preferentially at the bottom of the lungs. Notice also emphysematic appearance. A is a 9‐year‐old boy recently diagnosed demonstrating He demonstrates extreme difficulty in performing a smooth flow‐volume curve—note the jagged appearance. This is due to his mucus‐filled airways appearing on HRCT as white lines with budding—tree in bud. Later on, his lung function and HRCT improved significantly by treatment. B panel is a 72‐year‐old female with PCD just keeping an FEV1 above 40% of predicted
