FIGURE 1.

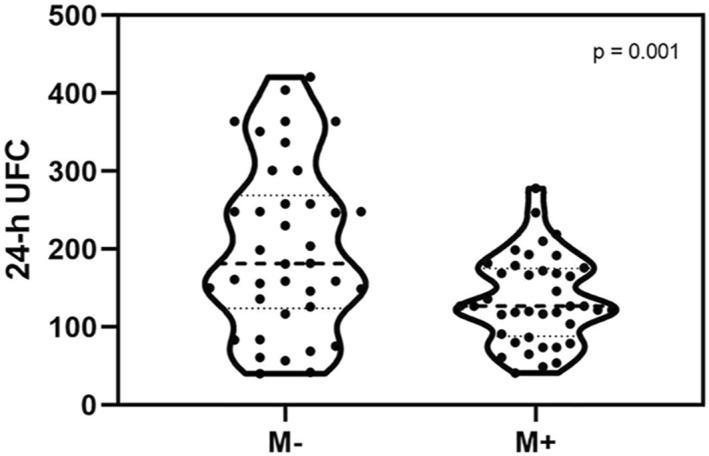
Graphical representation of the distribution of 24‐h UFC in the participants. The M− subgroup showed a higher excretion of urinal cortisol at the admission in the ward than M+, which presented a blunt cortisol urinal excretion

Graphical representation of the distribution of 24‐h UFC in the participants. The M− subgroup showed a higher excretion of urinal cortisol at the admission in the ward than M+, which presented a blunt cortisol urinal excretion