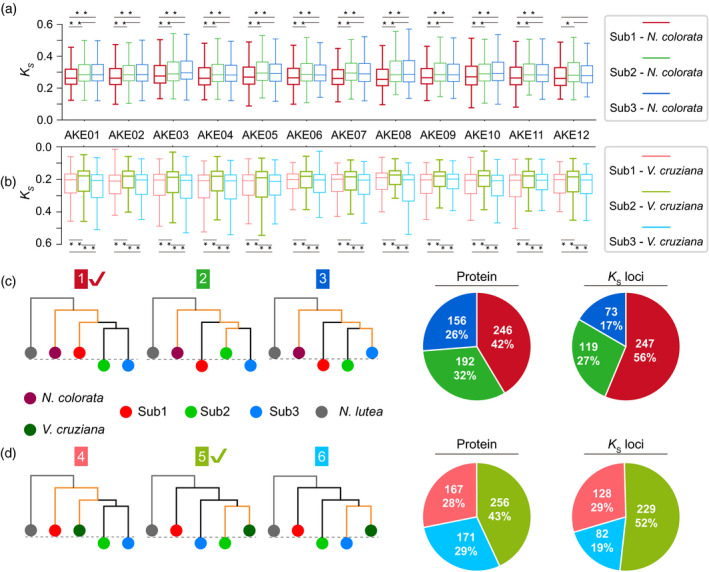
Figure 2.

The separation of the three sub‐genomes in Euryale ferox.
Boxplots of K s values on syntenic genes between Nymphaea colorata and E. ferox (a), as well as between N. colorata and E. ferox (b) for each ancestral karyotype of E. ferox (AKE) chromosome (AKEC). Variance tests were performed with * denoting P < 0.05 and ** denoting P < 0.01. The six candidate topologies of the phylogenetic tree, with the three topologies in (c) showing the phylogenetic tree on syntenic genes between the three sub‐genomes of E. ferox and the genome of N. colorata, as well as the pie diagrams for the corresponding tree (the same color) on the left. The three trees in (d) show the phylogenetic tree on orthologous genes between the three sub‐genomes of E. ferox and the genome of Victoria cruziana, as well as the pie diagrams for the corresponding tree. [Colour figure can be viewed at wileyonlinelibrary.com]
