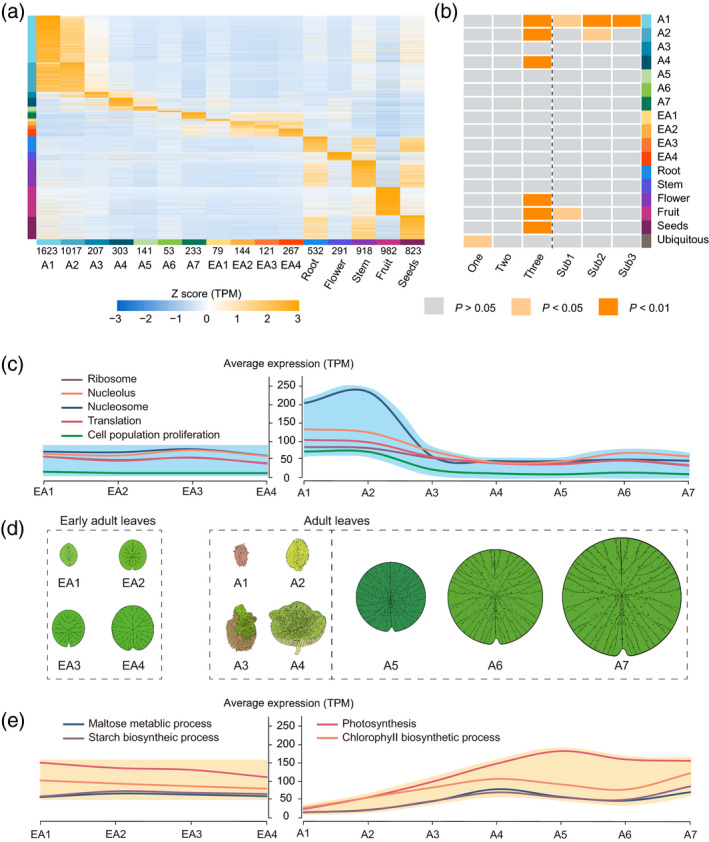
Figure 4.

Expression atlases of Euryale ferox leaves in different developmental stages and other organs.
(a) Expression profiles of sample‐specific genes in E. ferox. Genes are listed along the y‐axis; samples are listed along the x‐axis. The numbers at the bottom of the x‐axis indicate the number of sample‐specific genes in each sample. Bars on the left of the heatmap show the sample‐specific genes, which correspond to the samples in the same colors on the bottom of the x‐axis.
(b) The heatmap shows the enrichment levels of sample‐specific genes and ubiquitous genes (y‐axis) in different sets of genes as listed in the x‐axis; one, two and three represent the copy number of polyploidized genes; Sub1, Sub2 and Sub3 represent the sub‐genomes to which the genes belong.
(c) The average expression level of differentially expressed genes (DEGs) related to photosynthesis between early adult and adult leaves.(d) The morphology of adult and early adult leaves of E. ferox. EA1–EA4 are early adult leaves; A1–A3 are adult leaves underwater; A4 is the adult leaf just rising from the water; and A5–A7 are leaves above‐water.
(e) The average expression level of DEGs related to cell proliferation between early adult and adult leaves. [Colour figure can be viewed at wileyonlinelibrary.com]
