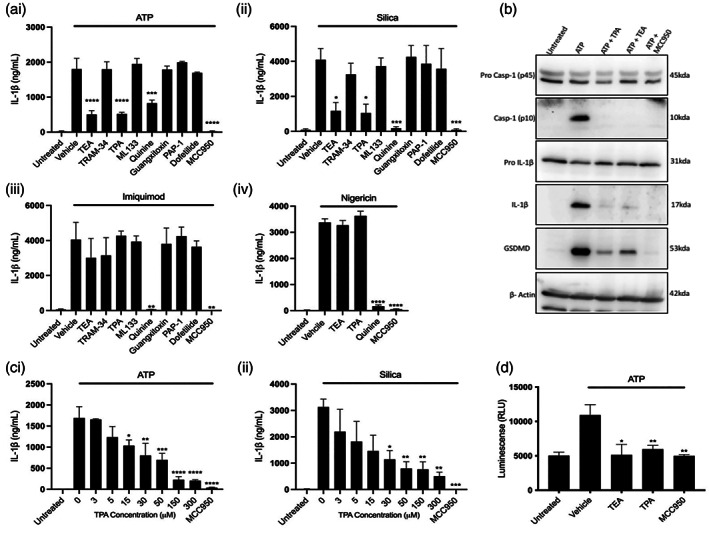
FIGURE 1.

Pharmacological inhibition of two pore domain potassium channels blocks NLRP3 inflammasome activation and IL‐1β processing. (ai–iii) IL‐1β ELISA of the supernatant of pBMDMs primed with LPS (1 μg ml−1, 4 h) followed by pretreatment with MCC950 (10 μM) or K+ channel inhibitors TEA (50 mM), TRAM‐34 (10 μM), TPA (50 μM), ML‐133 (20 μM), quinine (100 μM), Guangitoxin‐1E (25 nM), PAP‐1 (2 μM), or Dofetilide (1 μM) for 15 min before stimulation with ATP (5 mM, 1 h) (n = 4), silica (300 μg ml−1, 4 h) (n = 5) or imiquimod (75 μM, 2 h) (n = 3). (Aiv) IL‐1β ELISA of the supernatant of pBMDMs primed with LPS (1 μg ml−1, 4 h) followed by pretreatment with MCC950 (10 μM) or TEA (50 mM), TPA (50 μM), quinine (100 μM), for 15 min before stimulation with nigericin (10 μM, 1 h) (n = 4). (b) Caspase‐1, IL‐ β and gasdermin D western blot of total cell lysates (cell lysate + supernatant) from LPS‐primed (1 μg ml−1, 4 h) pBMDMs pretreated with vehicle control, TEA (50 mM), TPA (50 μM) or MCC950 (10 μM) for 15 min then stimulated with ATP (5 mM, 1 h). (c) IL‐1β ELISA of the supernatant of pBMDMs primed with LPS (1 μg ml−1, 4 h) followed by pretreatment with MCC950 (10 μM) or TPA (3–300 μM) before stimulation with ATP (5 mM, 1 h) (n = 5) or silica (300 μg ml−1, 4 h) (n = 3). (d) Caspase‐1 Glo assay to measure caspase‐1 activity of LPS‐primed (1 μg ml−1, 4 h) pBMDMs pretreated with vehicle control, TEA (50 mM), TPA (50 μM) or MCC950 (10 μM) for 15 min then stimulated with ATP (5 mM, 1 h). ****p < .0001, ***p < .001, **p < .01, *p < .05 determined by one‐way ANOVA with Dunnett's post hoc analysis. Values shown are the mean ± SEM
