
FIGURE 1.
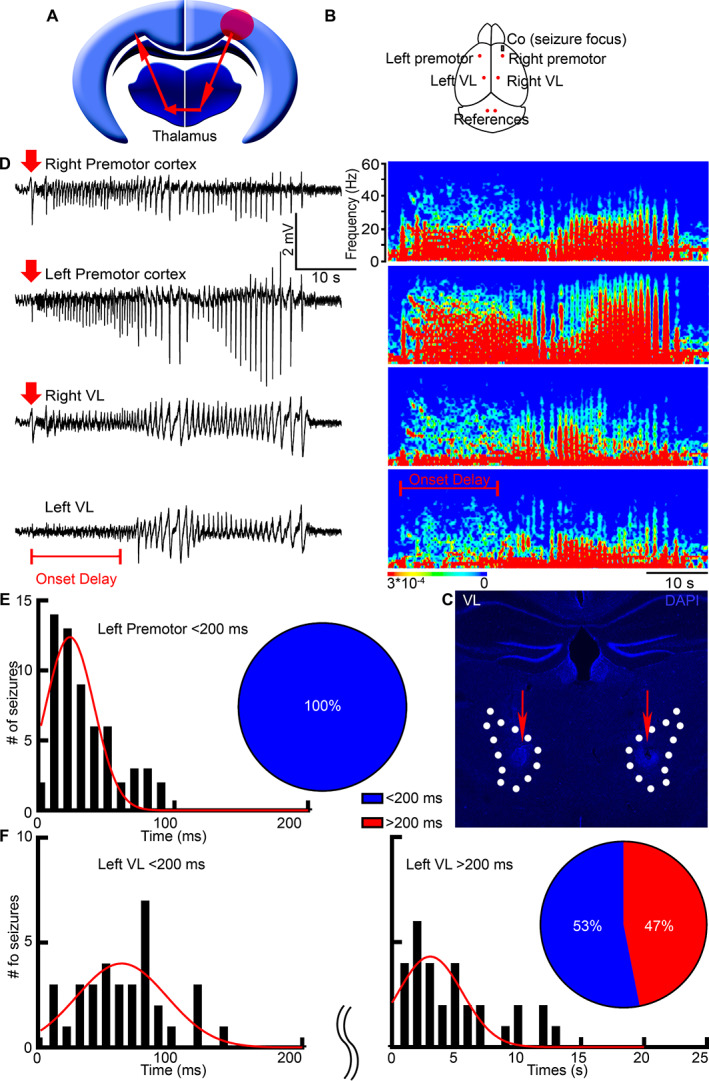
Seizures spread faster to the contralateral cortex than to the contralateral thalamus. (A) A schematic illustrates the classic centrencephalic model. Red arrows represent a bilateral spread of neuronal activity. The red circle is the seizure focus. (B) A schematic shows cobalt (grey rectangle) and LFP electrode placement (red dots). (C) We marked the electrode tips' location in the VL (dotted lines) by creating an electrical lesion at the end of the recordings (red arrows). (D) LFP microelectrodes record simultaneously from the bilateral premotor cortex and bilateral thalamic nucleus VL with the corresponding power spectrums. The seizure focus was in the right premotor cortex. Red arrows indicate seizure onset (amplitude twice the baseline); the red bar indicates seizure onset delay in the left VL. (E) Frequency distribution histogram shows seizure onset times in the left premotor cortex after seizure beginning in the right premotor cortex. Pie chart: 100% of seizures required < 200 ms (blue) to arrive at the left premotor cortex. (F) Frequency distribution histogram shows seizure onset times in the left VL. Pie chart: 53% of seizures required < 200 ms (blue) to arrive at the left VL from the right premotor cortex, and 47% required > 200 ms (red). LFP = local field potential; VL = ventrolateral.