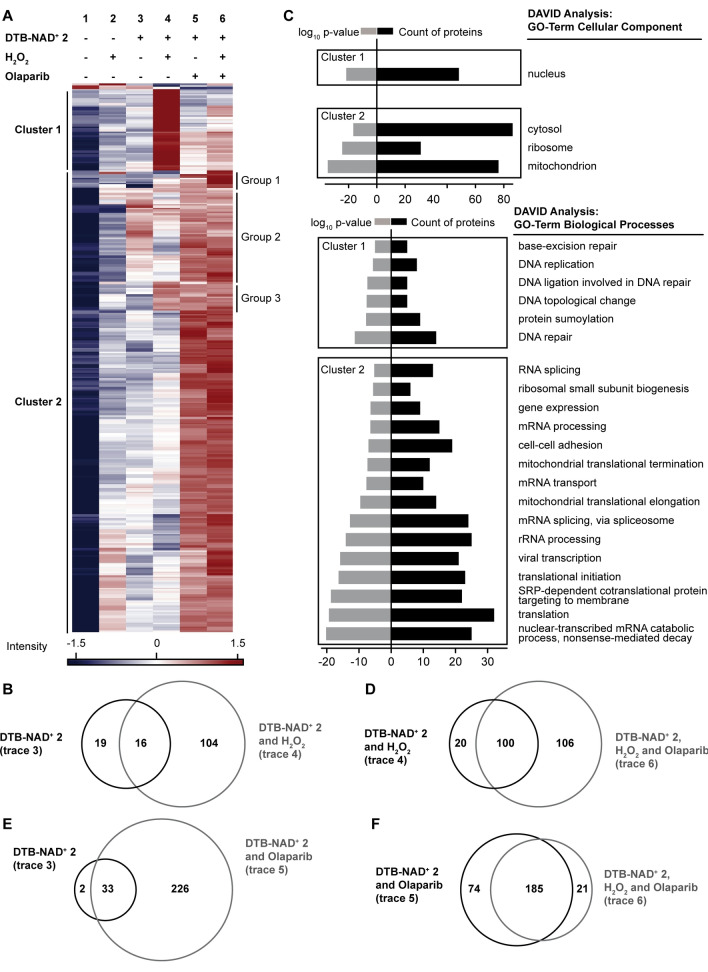
Figure 5.
Statistical analysis of ADP‐ribosylated proteins using DTB‐NAD+ 2. A) Heatmap of endogenous ADP‐ribosylated proteins in HeLa cells. 310 significantly enriched targets were identified by LC‐MS/MS analysis and label free quantification (FDR: 0.002; S0=2). B) Venn diagram showing the overlap between ADP‐ribosylated targets from untreated (trace 3) and cells treated with H2O2 (trace 4). C) GO‐term analysis: proteins significantly enriched in ANOVA analysis were classified according to cellular components and biological processes using DAVID (complete dataset see Supporting Information). D–F) Venn diagrams showing the overlap between ADP‐ribosylated targets found in the indicated experiments.

