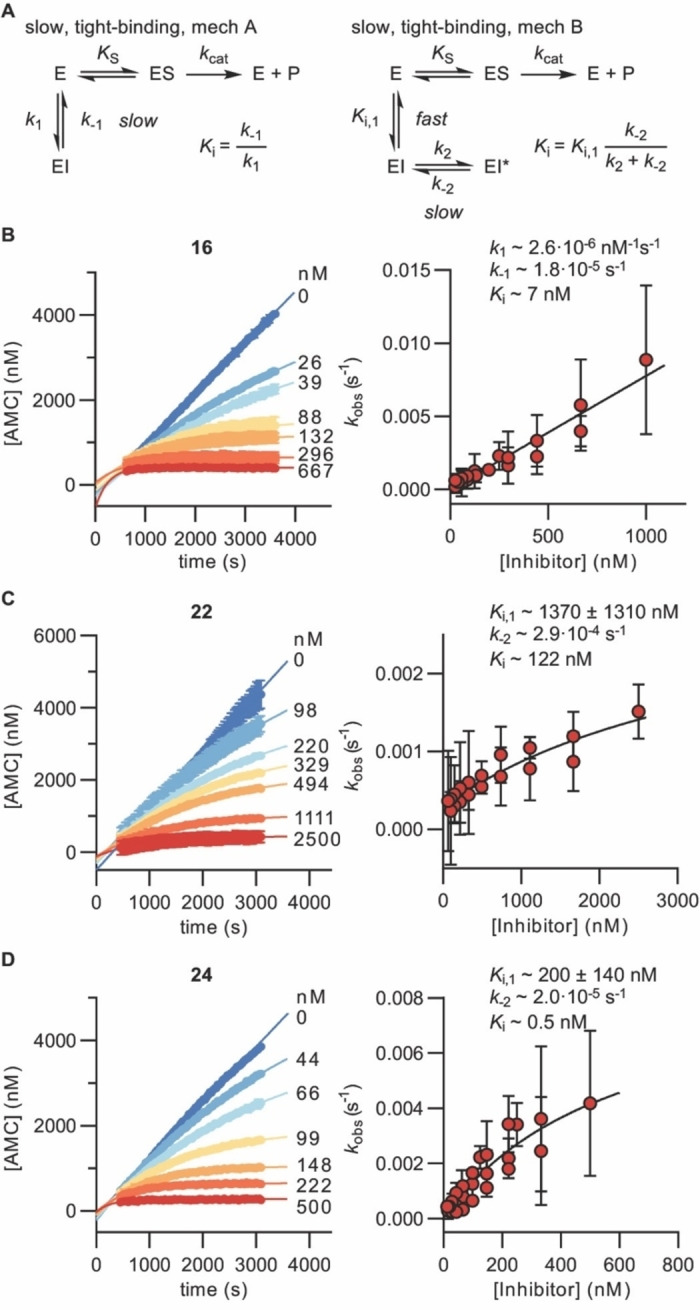
Figure 2.

Kinetics of SIRT5 inhibition by compounds 16, 22, and 24. A) Common mechanisms of slow‐binding inhibitor kinetics with associated equilibrium and rate constants. B)–D) Sample rate experiment curves and plots showing the dependence of k obs on inhibitor concentration for compound 16 (mechanism A) as well as compounds 22 and 24 (mechanism B). Concentrations of inhibitor for each experiment indicated on the right side of the curve. Continuous assays were performed with SIRT5 (80 nM), NAD+ (500 μM), Ac‐LGKglu‐AMC (40 μM) as substrate, trypsin (1.70 ng×μL−1). See Supporting Figure S3 and Table S4 for additional details and complete data fitting.
