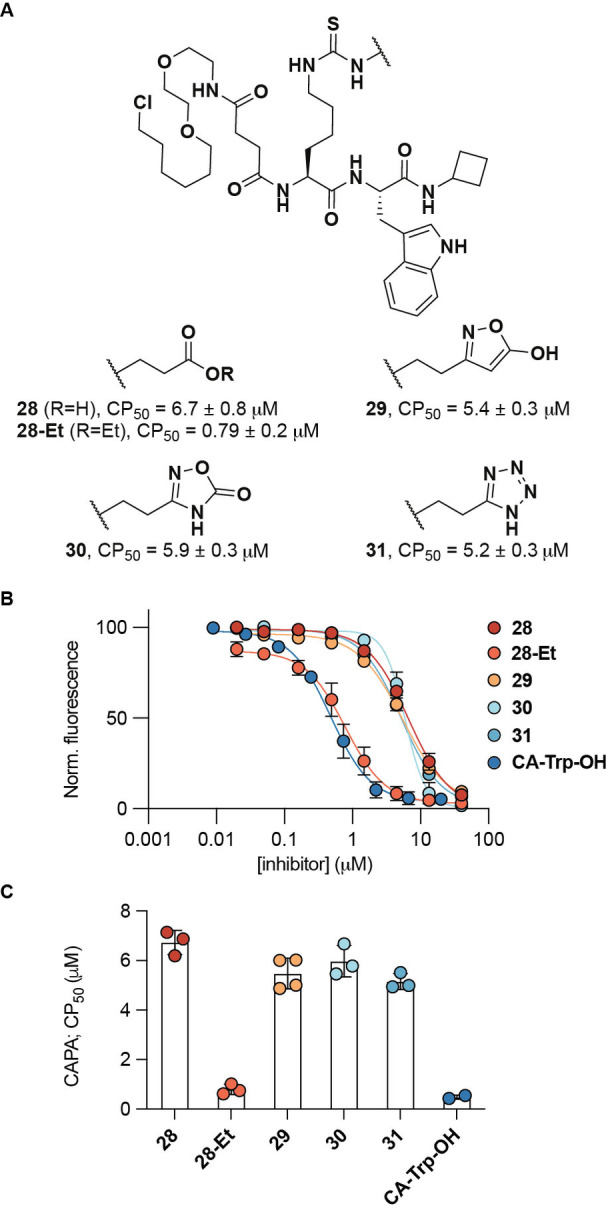
Figure 3.

Cell penetration profiling using CAPA. A) Structure of synthesized chloroalkane probes and their mean CP50 values±SD (n=3). B) CAPA results for compounds 28–31 and α‐N‐“chloroalkane”tryptophan CA‐Trp‐OH as the positive control after 4 hours of treatment with inhibitor (n≥2). C) Calculated CP50 values.
