Figure 5.
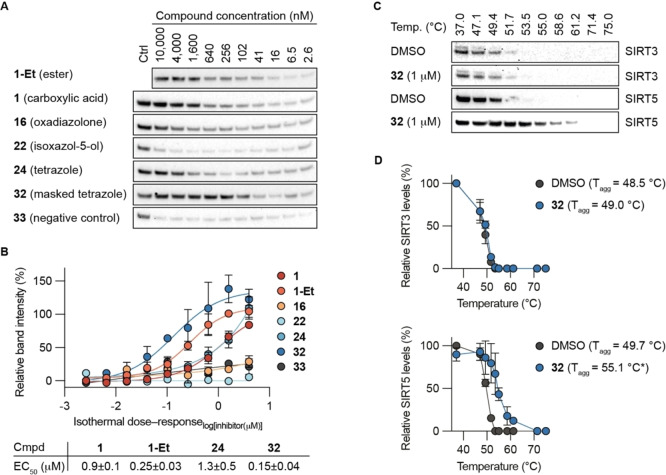
Cellular target engagement. A) Representative immunoblots for the thermal shift of SIRT5 in HEK293T cells subjected to 2 h treatment with inhibitor at concentrations varying from 2.6 nM to 10 μM and 1‐Et (10 μM) as internal control at 52 °C. B) Fitting of dose–response curves and calculated EC50 values. See the Supporting Information for full immunoblots (n≥2). EC50 values for compounds 16, 22, and 33 were all >10 μM. C) Representative immunoblots for the thermal shift of SIRT3 and SIRT5 in HEK293T cells after 2 h treatment with inhibitor 32 (1 μM) at temperatures ranging from 37–75 °C, comparted to DMSO control. D) Plots of the data and calculated T agg values (n=2; see the Supporting Information for full blots and replicates). Statistical significance of the CETSA shifts were calculated using unpaired t‐test of the T agg values from independent experiments. Adjusted p‐value for 32 against SIRT5: *p<0.05.

